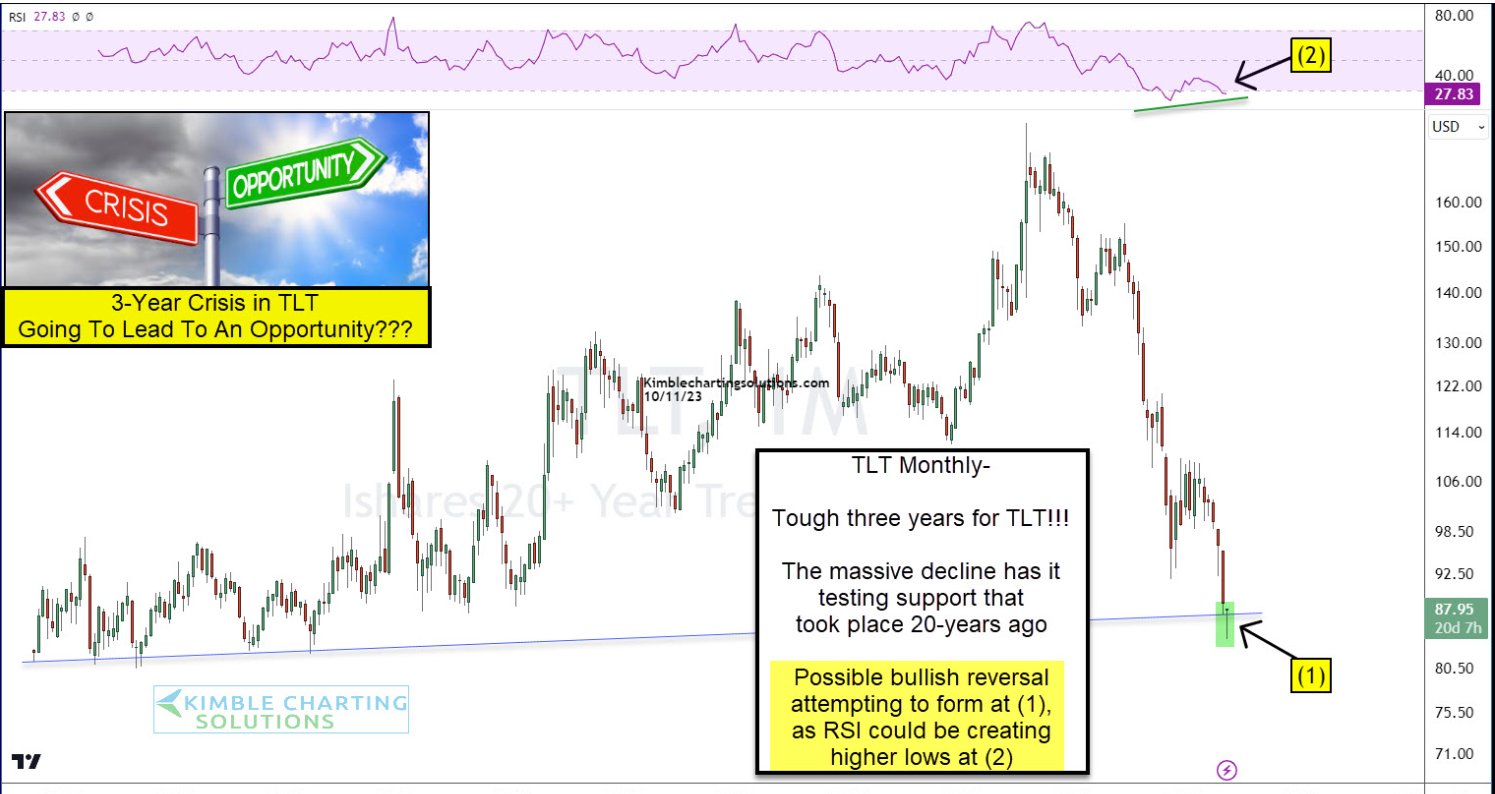
Chris Kimble of Kimble Charting Solutions is a favorite technician, and his work is read regularly for good reason.
The above chart from Kimble Charting Solutions highlights what could a potential bottom forming in the TLT or the iShares +20-year Treasury Bond ETF.
Readers and investors should know in a few days or weeks whether there is a bottom in for the TLT, and room for a short rally, but the longer answer is more complicated.
My own thoughts on Jay Powell and the FOMC raising the fed funds rate from zero in late 2016 (just after President Trump was elected President) to the 2.25% – 2.50% nominal rate at the mid-December ’18 peak, was to attempt to get the fed funds rate off of zero, as it had been for the last 8 years to try to instill some normalcy back in traditional US monetary policy.
Having the fed funds rate at zero as it was for 8 years between 2008 and late 2016, and then again from March, 2020 to March 2022, is not what I would think the Fed / FOMC would consider a “normal” by-product of monetary policy operations.
The point being that just in the last 18 months, the US economy has seen a 525 bp increase in the fed funds rate to the current 5.25% – 5.50% range, and while some may think at some point the US economy might warrant a 1% fed funds rate again, it’s just my opinion, but I don’t think Americans will ever see 0% – 1% fed funds rate ever again, at least in my lifetime.
Alan Greenspan took the fed funds rate down to the 3% in the early 90’s, and with a 3% inflation rate at the time, I thought that was about as low as we’d ever see the fed funds rate.
The point of all this being that while I personally think the fed funds rate will only get down to 2.5% – 3% in any recession, what that portends for longer-maturity Treasuries, mainly 10’s through 30’s is that – with a normally sloped Treasury curve, the TLT could gravitate around current prices in the high $80’s, low $90’s, for years, as Treasury yields normalize, and the yield curve returns to some relatively normal slope.
How do you calculate fair value on a Treasury ? From all my Money & Banking and bond management readings, the long-run, “real” (inflation adjusted” return on the Treasury curve is about 2%, meaning if you subtract the core inflation rate from the Treasury yield, if you get something close to 2%, you’re probably in the neighborhood of fair value (and that’s just my opinion).
Today, according to Morningstar, the iShare TLT’s SEC yield, is 4.85%, while the 12-month yield is 3.57%, thus splitting the difference on the TLT yield puts the average around 4.2%.
Using today’s inflation rates (anything but the inflation breakevens really) puts the TLT’s real return still well below 2%.
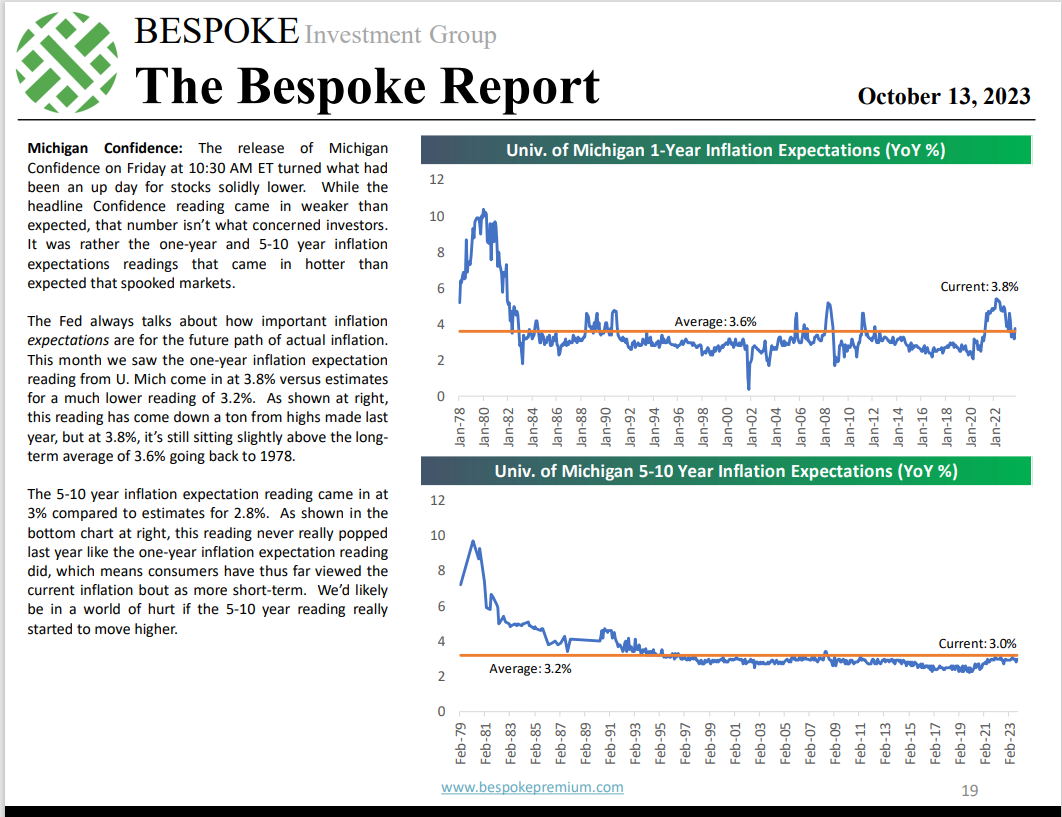
The recent University of Michigan 5 – 10 year inflation “expectations” report noted that inflation expectations were still around 3% per the U of M update, which also means the TLT is still overvalued, to a degree.
Summary / conclusion: The flip side of the Treasury valuation argument is that the Treasury yield curve has now been inverted for a long time, longer than what preceded the 2007 – 2008 recession (which is pretty amazing in and of itself), but again the argument is that we are exiting a period of monetary policy that was unprecedented in terms of it’s ZIRP (zero interest rate policy) thus this decade might require a longer re-set and a longer period of normalization. However the fact that the Treasury yield curve remains so inverted and for such a long period of time, and yet the latest jobs report showed +355,000 jobs added to the US economy in September PLUS, another 155,000 positive revisions to prior months jobs data, seems remarkably out of whack with either economic history or theory.
Has the TLT bottomed ? Frankly I haven’t a clue, but like readers, price movement will be watched carefully, and TLT positions will be added if necessary. The TLT is currently a 1% position in client accounts, and can easily be doubled.
Could the US capital markets be in for a decade of poor returns on bonds, as stocks had from 2000 to 2009 ? Absolutely, but remember, it’s all just naval gazing.
Frankly, I think the US could use a mild recession. I hear story after story about businesses who cannot fill job openings, and it’s a rather arduous process to hire just a handful of people. While meeting with a client in the Chicago area, they mentioned they had a friend they were out with the night before that was a assistant manager at Home Depot or Lowe’s (can’t recall which) and he noted that the store had recently interviewed 50 applications for 4 part-time positions. Another story was from a manufacturing facility in southern Wisconsin. This person explained to me that the business he worked for has several manufacturing facilities and they recently had trouble filling the last facility, and after hiring 75 – 100 regular daytime employees, within 6 months, most had left the company. I didn’t get into the “why’s” of that happening.
While manufacturing is a much smaller part of the US economy than it was 40 – 50 years ago, the manufacturing data weakened sharply in late 2022, but recently as this summer of 2023 has begun to re-accelerate. Services “demand” is still pretty robust and Jay Powell has to be scratching his head over that one, but the recovery in manufacturing the last few months is pretty odd, and it could UAW-strike related.
Rick Rieder, Blackrock’s bond guru thinks the 10-year US Treasury gets to 6%, Jamie Dimon says 7%.
The TLT is now oversold on all three timeframes: daily chart, weekly chart, monthly chart.
Remember, take this all with substantial skepticism, and a healthy dose of salt. All SP 500 EPS data is sourced from IBES data by Refinitiv, and it’s all just one person’s opinion. Past performance is no guarantee of future results, and this information may or may not be updated, and if updated may not be updated in a timely fashion. Capital markets can change quickly for both the good and the bad. Investors should gauge your own appetite for market and portfolio volatility and adjust portfolio’s accordingly.
Thanks for reading.