In a nutshell, so far so good.
Here’s a quick look at the trend in 2024’s SP 500 EPS:
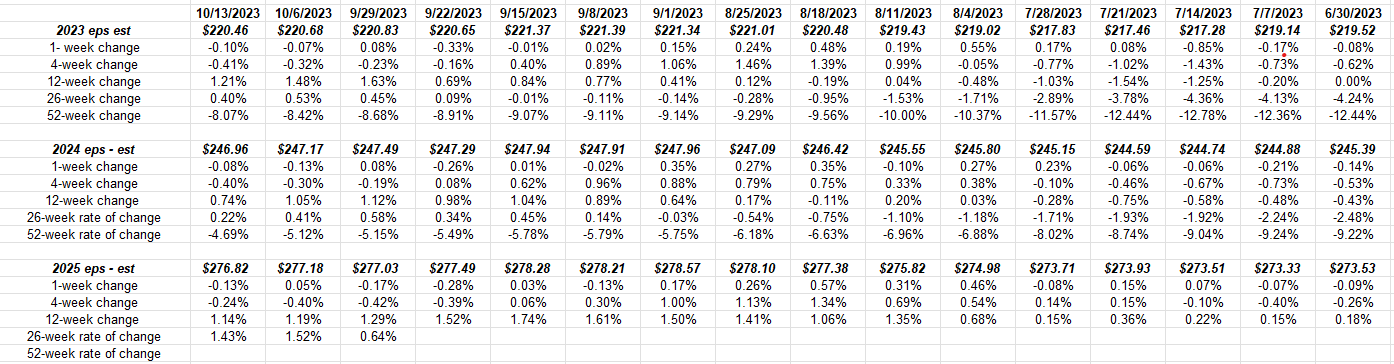
Source: IBES data by Refinitiv
2023 EPS estimates along with Q3 ’23 expectations will be discussed below, and 2025 EPS is still 15 – 18 months away from seeing the results that will impact the estimates, so the focus here is on 2024, which is the middle section of the above spreadsheet.
Readers can look at the 26 and 52-week rates of change to see the gradual improvement in expected 2024 SP 500 EPs estimates.
Current 2024 EPS estimates expect 10% – 12% SP 500 EPS growth next year, after 1% – 2% growth this year.
2025 is improving too, but again it’s a little early to “set it and forget it” in terms of equity index allocations or investment allocations for that timeframe.
Here’s a blog post from late June ’23 that talks about the same dynamics at work, even though the SP 500 and the Barclay’s Agg are now lower 10 weeks later.
The 2024 SP 500 EPS estimates continue to reflect positive revisions. That’s a good thing (for now). A www.seekingalpha.com reader asked me this past week if I “believed” the EPs estimates, as reflected in last week’s update. After doing this weekly update for the past 13 – 15 years, I have no reason not to believe forward estimates since they represent the collective opinion of Wall Street’s best minds, both analysts and strategists. Do they change ? Absolutely, sometimes for the better, sometimes not, but the positive revisions are supportive for now.
SP 500 data:
- The forward 4-quarter estimate (FFQE) fell last week to $239.22 from the prior week’s $239.93 and June 30th’s $224.01;
- The PE ratio ended Friday, October 13th, ’23 at 18x
- The SP 500 earnings yield ended the week at 5.53% versus the prior week’s 5.55%;
- The Q3 ’23 bottom up estimate of $55.78 hasn’t changed much since it’s 6/30/23 value of $55.89;
- Usually this blog updates the “upside” surprise” for both SP 500 EPS and revenue, which is 11% and +1.2% respectively, but so few companies have reported, the data isn’t really significant right now. There will be another 56 companies reporting this week, per Refinitiv.
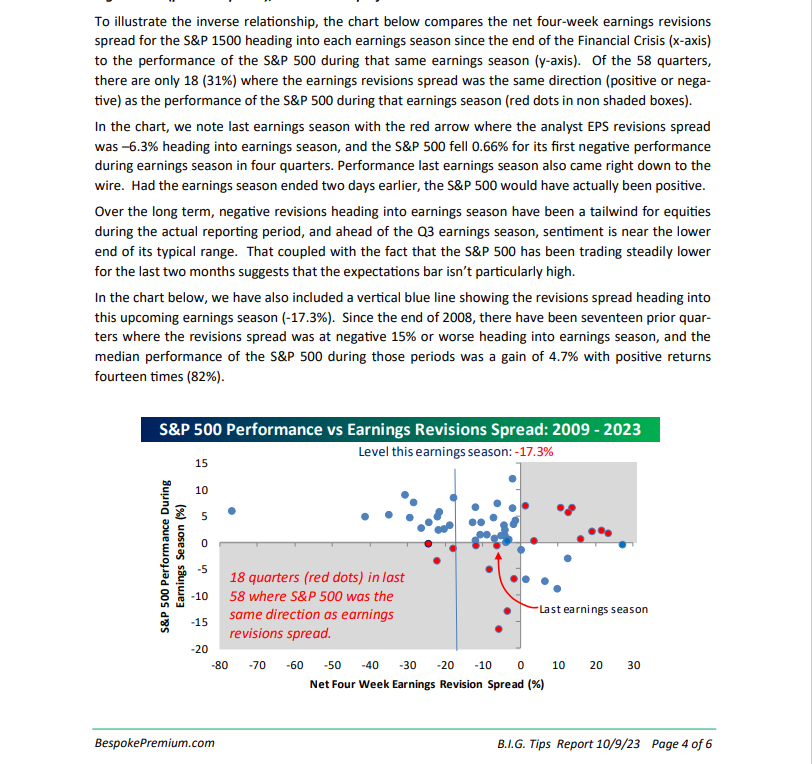
This chart from Bespoke previews the SP 500 revision activity (bottom-up activity) which is inversely correlated to actual SP 500 performance during the reporting period.
Blog readers can read the three paragraphs cut-and-pasted from Bespoke’s update on October 9, 2023, but it does expect a positive forward return for the SP 500 for Q4 ’23.
In other words, the Q4 ’23 “seasonal rally” for the SP 500 is still expected. In 2020, it didn’t really start until November 1, ’20.
Summary / conclusion: Q3 ’23 SP 500 earnings should be fine, and 2024 is still looking positive as well, and Bespoke’s work given the above p.4 of Bespoke’s earnings update attached above, reflects the expectation of a positive forward return for the SP 500 for Q4 ’23.
Ed Yardeni, who does great SP 500 earnings work, remains positive on forward SP 500 earnings as well.
The fly in the ointment continues to be interest rates, particularly the 10 through 30 year Treasury maturities. The more these interest rates rise, the greater the likelihood the SP 500 trades like a marathoner running a race, with a piano on his/her back.
Historically, Treasuries have a long run “real return” (inflation adjusted) of 2%. Inflation data this week – the CPI and PPI – likely implies that the 10-year Treasury yield still has room to rise. However looking at PCE data and more importantly, the 10-year inflation breakevens mean at 4.60% – 4.80%, the 10-year Treasury yield is now more fully and fairly valued.
Like everything else on Wall Street – and like the good country lawyer says – “I can argue it either way”.
It’s becoming clear from the litany of Federal Reserve-affiliated comments, that the Fed / FOMC is close to or actually intends to hold the fed funds rate stable here. That’s a positive.
We’ll see. In the capital markets, everything changes.
Take all of this with substantial skepticism, and a serious pinch of salt. All SP 500 EPS data is sourced from IBES data by Refinitiv, but a lot of the math and the manipulations therein are this blogs. This blog represents just one opinion, and everything in the capital market changes, both for the good and bad. Past performance is no guarantee of future results, and the above information may or may not be updated and if it is updated, may not be done on a timely basis.
Thanks for reading.