Return data courtesy of Morningstar, Inc.
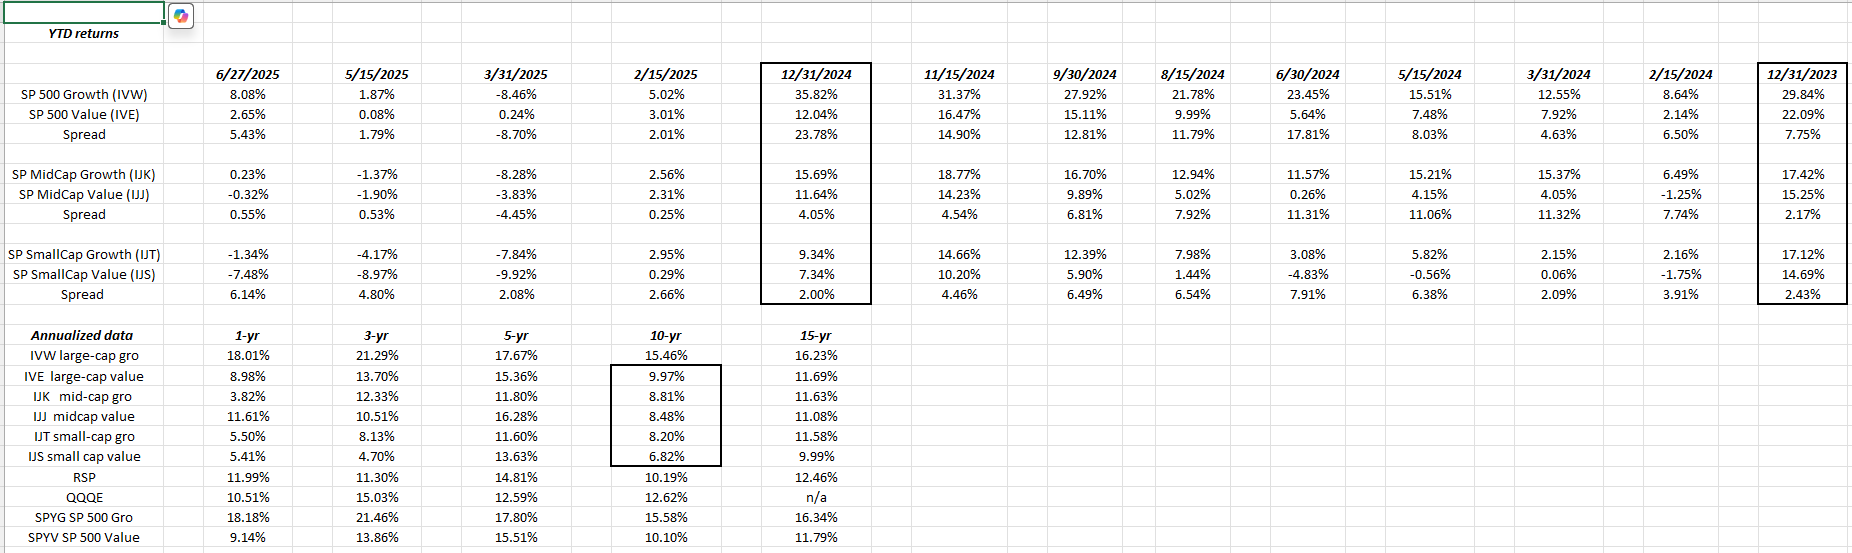
Probably of little surprise to readers, but the growth style of investing continues to beat value looking at year-to-date returns, although by smaller amounts than the previous years, which is also understandable given that the SP 500 has returned just 5.55% YTD in 2025, versus the 25% returns for the SP 500 in 2023 and 2024.
SP 400 MidCap annual returns vs the SP 500: (annual return)
- 1/1/2000 through 6/27/205: The MidCap ETF (MDY) returned +9.20% while the SP 500 returned +7.78%;
- 1/1/2010 through 6/27/2025: Midcaps returned +11.25% while the SP 500 returned +13.82%;
- 1/1/2015 through 6/27/2025: Midcaps returned +8.88%, vs the SP 500’s +13.05%;
- 1/1/2020 through 6/27/2025: Midcaps returned +9.16% vs the SP 500’s +14.29%;
Midcap performance relative to SP 500:
- 1/1/2000 – 6/27/2025: 142 bp’s per year outperformance;
- 1/1/2010 – 6/27/2025: -257 bp’s per year underperformance;
- 1/1/2015 – 6/27/2025: -417 bp’s per year underperformance;
- 1/1/2020 – 513 bp’s per year underperformance;
Russell 2000 vs the SP 500: (annual return)
- 1/1/2000 through 6/27/2025: The R2k returned +7.32%, vs the SP500’s returned +7.78%;
- 1/01/2010 through 6/27/25: The R2k returned +9.85%, vs the SP 500’s +13.82%;
- 1/01/2015 though 6/27/25: The R2k returned +7.24%, vs the SP 500’s +13.05%;
- 01/01/2020 through 6/27/25: The R2k returned +6.24% vs the SP 500’s +14.29%;
Russell 2000 performance relative to SP 500:
- 1/1/2000 – 6/27/2025: -46 bp’s per year underperformance;
- 1/1/2010 – 6/27/2025: -397 bp’s per year underperformance;
- 1/1/2015 – 6/27/2025: -581 bp’s per year underperformance;
- 1/1/20 – 6/27/2025: -805 bp’s per year underperformance;
Summary / conclusion: First, apologies to readers for cutting off the end data for the annual return data as of June 27th, but the time it took to develop and write this post couldn’t have been done on July 1 ’25, given other tasks. Besides, will June 30th make enough of a difference in annual return data, dating back 5,10, 15 and 25 years ? Probably not.
The Russell 2000 (R2k, i.e. small-cap benchmark) is getting a lot of ink lately for it’s relative performance versus the SP 500, and for good reason, but what’s not been mentioned is the R2K’s relative performance is getting uglier the more recent the timeframe.
Also what I found interesting is that mid-cap’s (SP 400) are all but ignored in the discussion.
It was surprising to see that the SP 400 Mid-Cap (MDY) actually outperformed the SP 500 the 25.5 years, from January 1, 2000, by 142 bp’s a year. (That’s not too shabby.) (Another aspect that requires explanation for readers is that YCharts, which has a date-to-date performance calculator (a poor man’s Bloomberg) doesn’t have a “SP 400 Mid-Cap Total Return” category, so the MDY or the SPDR MidCap Blend ETF is used as the proxy for the benchmark.
Looking at the style-box spreadsheet at the very top of the page, the 10-year returns for both the MidCap and Russell 2000 style boxes are still below 10%. Small-cap value, if you look at some of the bigger ETF’s like IJS (iShares SP 600 SmallCap Value ETF) and IWN (Russell 2000 Value ETF) both show that the financial sector has a weighting in each ETF of 25%.
What’s a potential catalyst for the small cap financials ? After financials, industrials were the next largest sector, and then consumer cyclicals.
The blog keeps an eye on this stuff, just to touch all the bases in the various segments of the equity market that have been less-emphasized or given less press attention the last 5 years.
The spreadsheet at the top gives YTD returns and then shows how the various style boxes performed the last two calendar years.
None of this is advice or a recommendation but only an opinion. Past performance is no guarantee of future results. None of this information may be updated and if updated may not be done so in a timely fashion. Readers and investors should evaluate their own comfort with market volatility and adjust accordingly.
Thanks for reading.