
It’s difficult not to look at this Trendspider chart and not be be bullish gold, silver and platinum.
Although this blog missed the move in gold (and never traded silver or platinum), having followed the precious metal since the late 1970’s, when Paul Volcker was Fed Chairman, the fascinating aspect to this latest price move in gold is that it’s occurring with positive correlation to the SP 500, as opposed to the negative correlation that gold had with equities for the last 40 years.
Gold bullion (gold bars) peaked around $800 per ounce in the 1980, just as Paul Volcker was maxing out his fed fund rate increases near 20% in the spring of 1980 – the fed funds rate peaked at 20% and the 30-year Treasury yield peaked around 15% at the same time – and then gold began to slide through the secular bull market for the SP 500 from August, 1982, to March of 2000.
Gold bullion (again) began to bottom in late 1999, around $200 an ounce, and really took off again as the technology and growth stocks resulted in the SP 500 peaking in March, 2000, and then gained steam for the rest of the decade from 2000 through 2010. The problem was – for investors – that you were forced to buy gold-related equities like miners or common stocks for clients like Newmont Mining (NEM) whose revenue, earnings and cash flow at the time were driven primarily by gold mining. (Per Morningstar, Newmont Mining is the world’s largest gold miner.)
That was the case until SPDR (S&P Depository Receipts) created the GLD ETF that was launched in January, ’05, which promptly became one of the biggest ETF’s in the capital markets by the late 2000’s. Obviously, the GLD ETF allowed investors to buy exposure to gold in a traditional equity instrument like an ETF, without having to buy an operating company whose business was tied to gold mining.
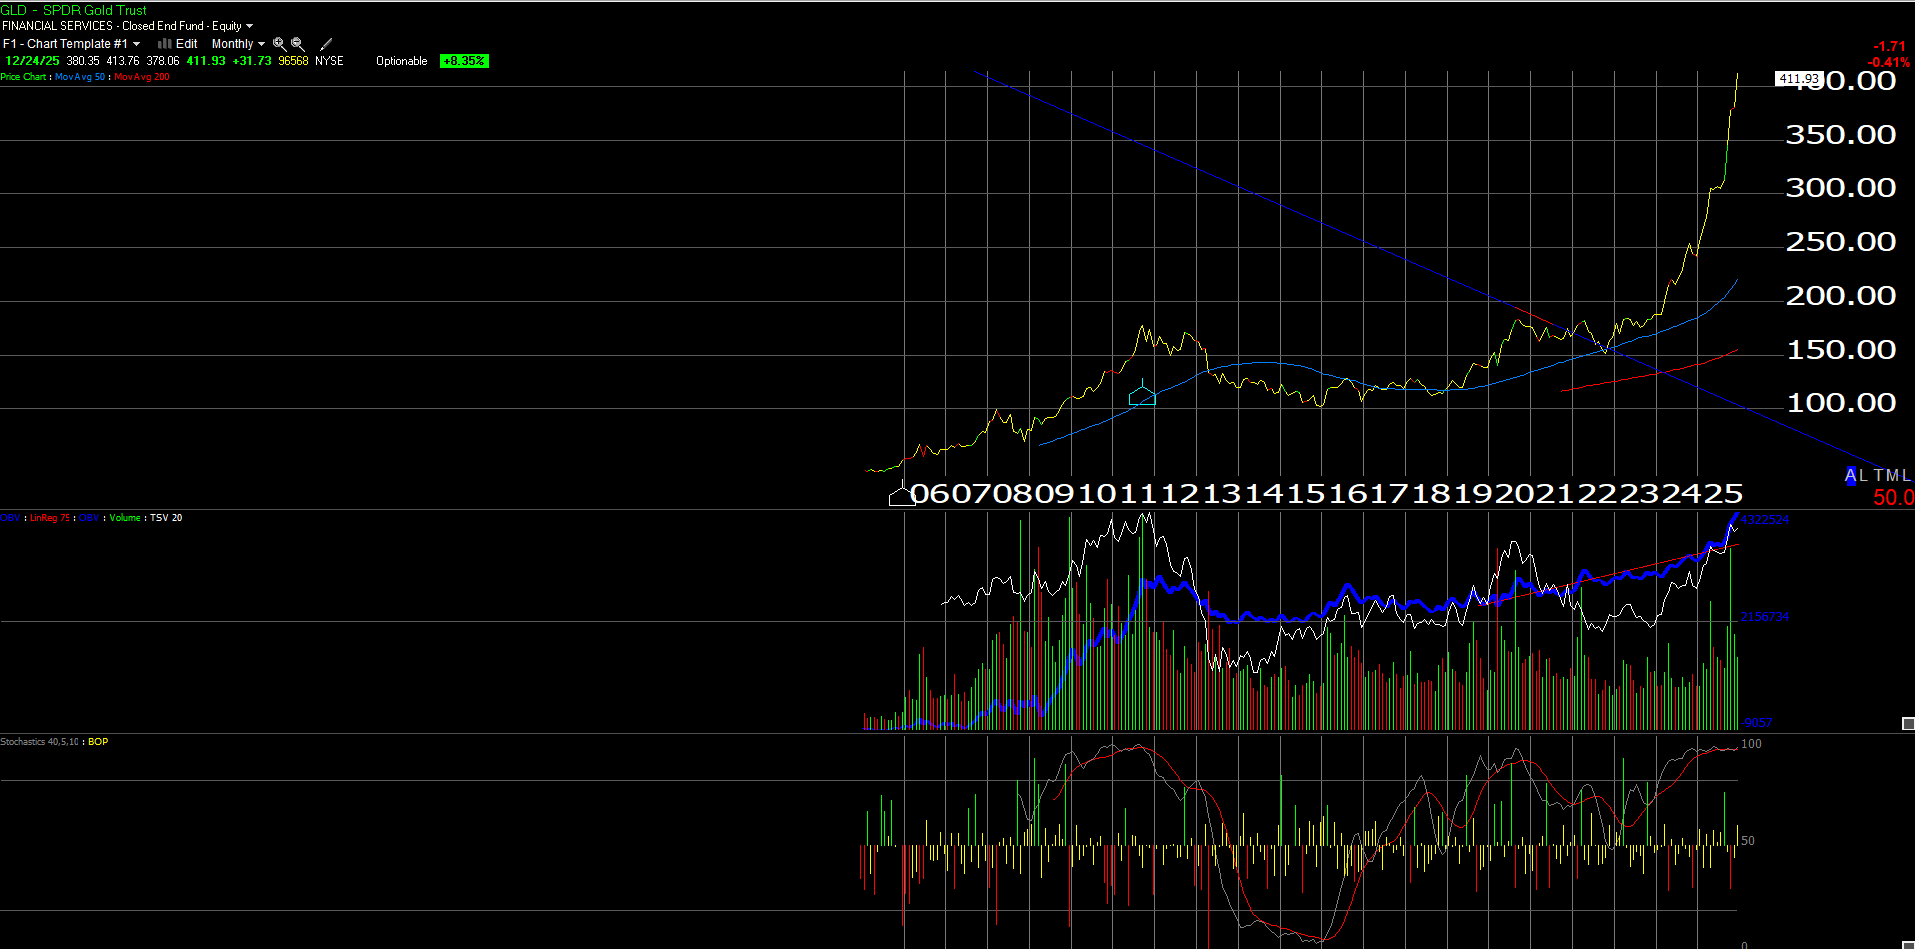
This GLD monthly chart shows GLD peaking at $185 in the month of September, 2011, which is 30 months after the SP 500 bottomed from it’s historic bear market on March 9th, 2009.
Annual Returns of Gold vs the SP 500:
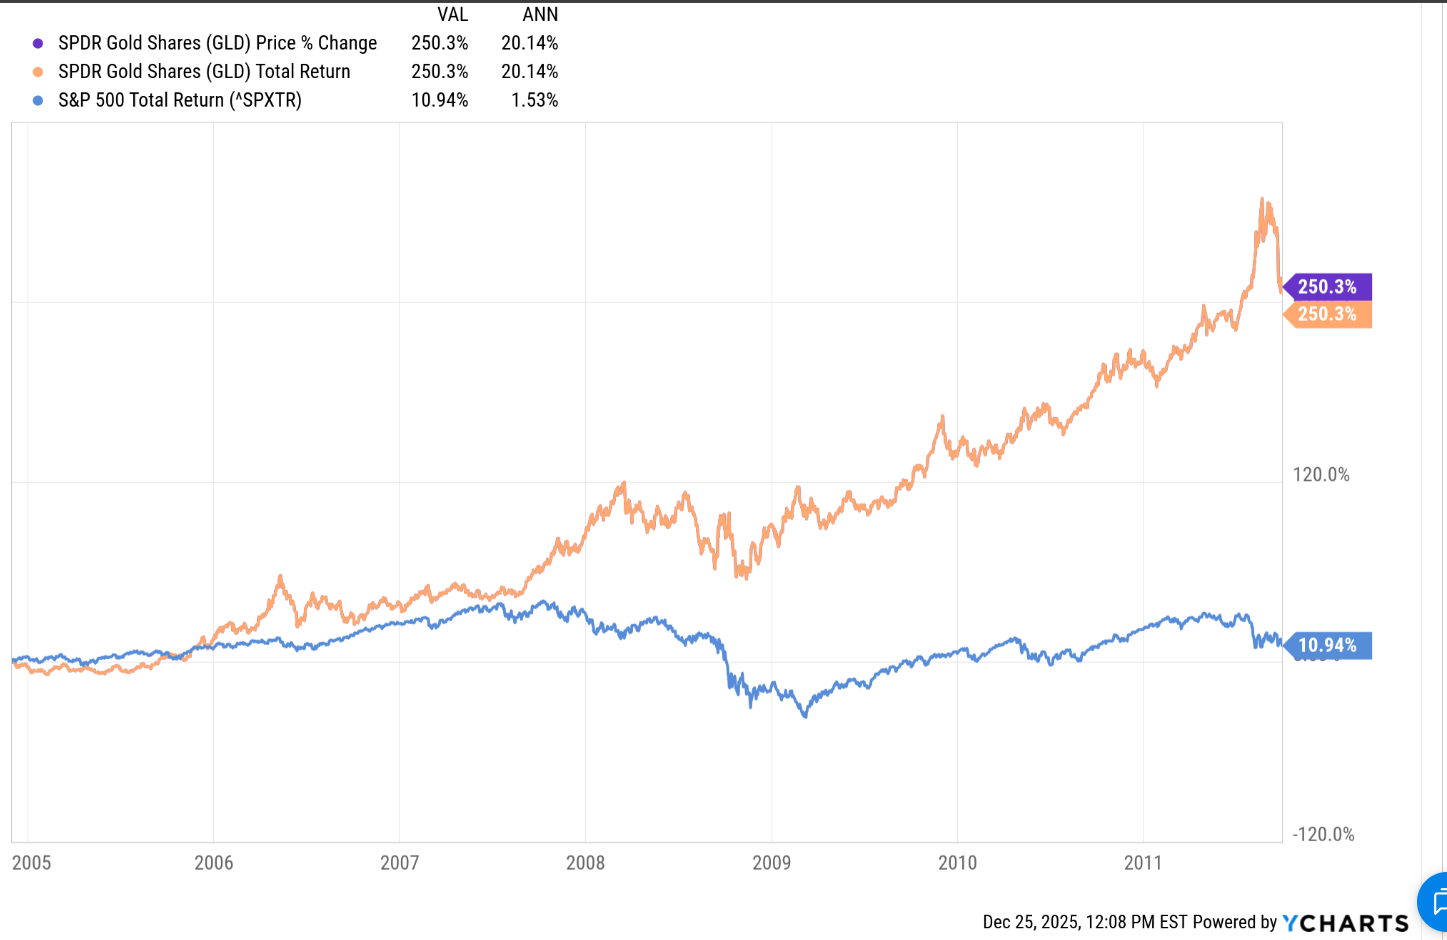
This Ychart graphic shows the annual returns of the GLD ETF from it’s first month of trading through it’s all-time-high month in September, 2011. Even with the SP 500 bottoming in March, 2009, the performance disparity is considerable.
Note the magnitude of GLD’s outperformance relative to the SP 500 total return from 2005 through September, 2011.
Now, let’s look at the GLD vs the SP 500 annual returns from September, 2011 through October ’23 when GLD broke above the September, 2011 high:
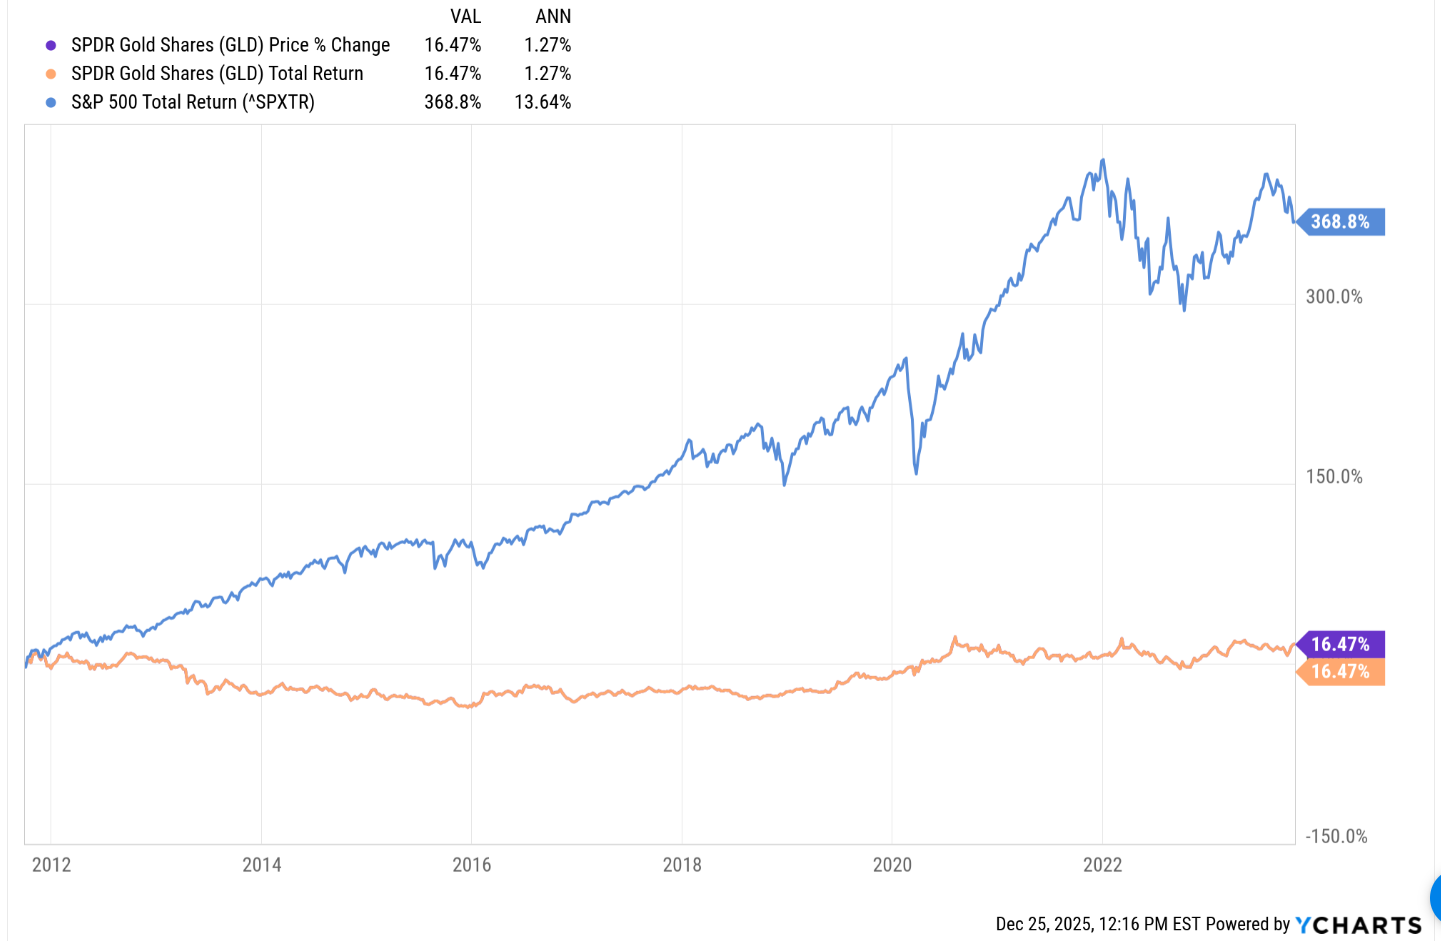
The negative correlation should be obvious to readers given the returns from when the SP 500 was in a bear market, vs the ensuing period when the SP 500 was in a fresh, new, bull market.
Is gold telling investors something today about the prospective returns for the SP 500 ? Is the negative correlation between the two asset classes which existed for roughly 40 years (and maybe longer than that) now completely broken and are the two asset classes now positively correlated ?
Summary / conclusion: While this blog is cautious on prospective SP 500 and Nasdaq returns going forward, this blog post today is really a way to show readers that correlations between asset classes do matter, and that they also can change over time too.
The fact that the GLD didn’t peak in September, 2011, until after 30 months after the SP 500 bottomed, also tells me that there can be lags in the correlation. The bottom for gold bullion in late 1999, and the peak for the SP 500 and Nasdaq in March, 2000, was much tighter than the time lag between the GLD peak in September, 2011 and the bottom for the SP 500.
Is gold signaling an issue for the SP 500 and the Nasdaq again ? It’s possible, although GLD’s breakout in October, 2023 has now occurred even as the SP 500 made new highs in late 2025.
Bitcoin – once referred to as digital gold – does present an interesting variable to this whole debate. Bitcoin seems to have weakened in price while the rally in gold grows stronger, even though they can be thought of as similar asset classes since neither are operating entities nor do they generate any cash-flow or free-cash-flow.
From 1980 to 2000, and then from 2010 to October ’23 gives readers a feel for how long the “gold versus SP 500” performance dispersion can last.
Readers should take away from all this that – either the rally in gold stalls here pretty soon as the SP 500 hits new all-time-highs – or the SP 500’s prospective returns start to diminish given the traditional correlation history between gold and SP 500 returns.
None of this is advice or a recommendation, but only an opinion. Past performance is no guarantee of future results. Clients should gauge their own comfort with portfolio volatility and act accordingly.
Thanks for reading.