Expected SP 500 EPS growth for Q4 ’25 is now +13.5% as of Friday, February 6th, 26, versus the expected +8.8% y-o-y EPS growth rate on January 9 ’26.
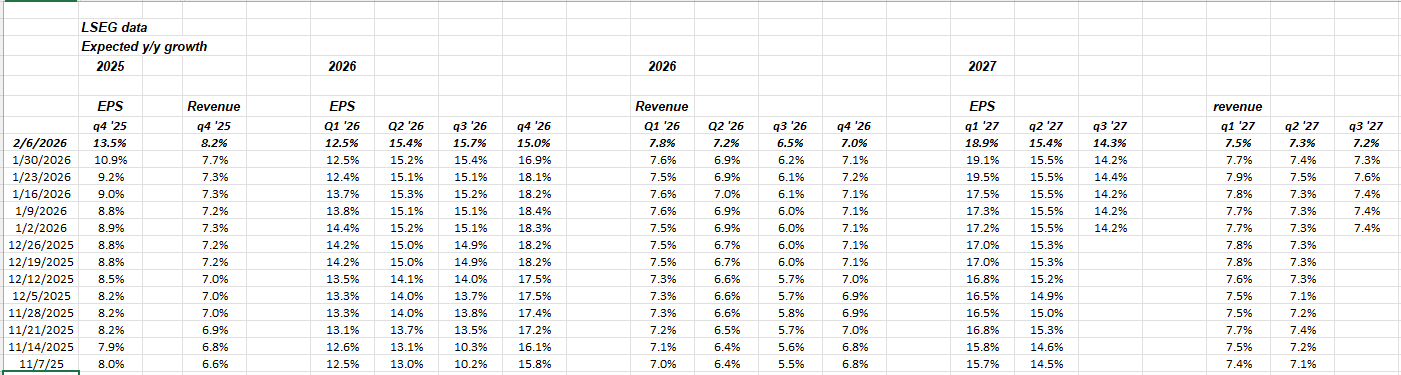
(Data source: LSEG I/B/E/S)
Even Q4 ’25 expected revenue growth jumped 500 bp’s this week to +8.2% yoy growth versus last week’s +7.7%. (Note the weekly revision to revenue growth across the periods.)
While at the Matt McCormick Investment Symposium last Friday, February 6th, 2026, at Xavier University in Cincinnati, Ohio, one of the two featured guests was Manuel Abacasis, a Goldman Sachs economist who talked about Goldman’s 2026 economic forecast. Manuel thinks that GDP will come in a little stronger-than-expected, while inflation will likely come in below-consensus, with the labor market a question mark.
These are my conclusions drawn from listening to the 1-hour presentation, and hopefully haven’t misrepresented anything Manuel presented.
The point being, the forecast and presentation was a little more bullish and favorable to the capital markets than expected.
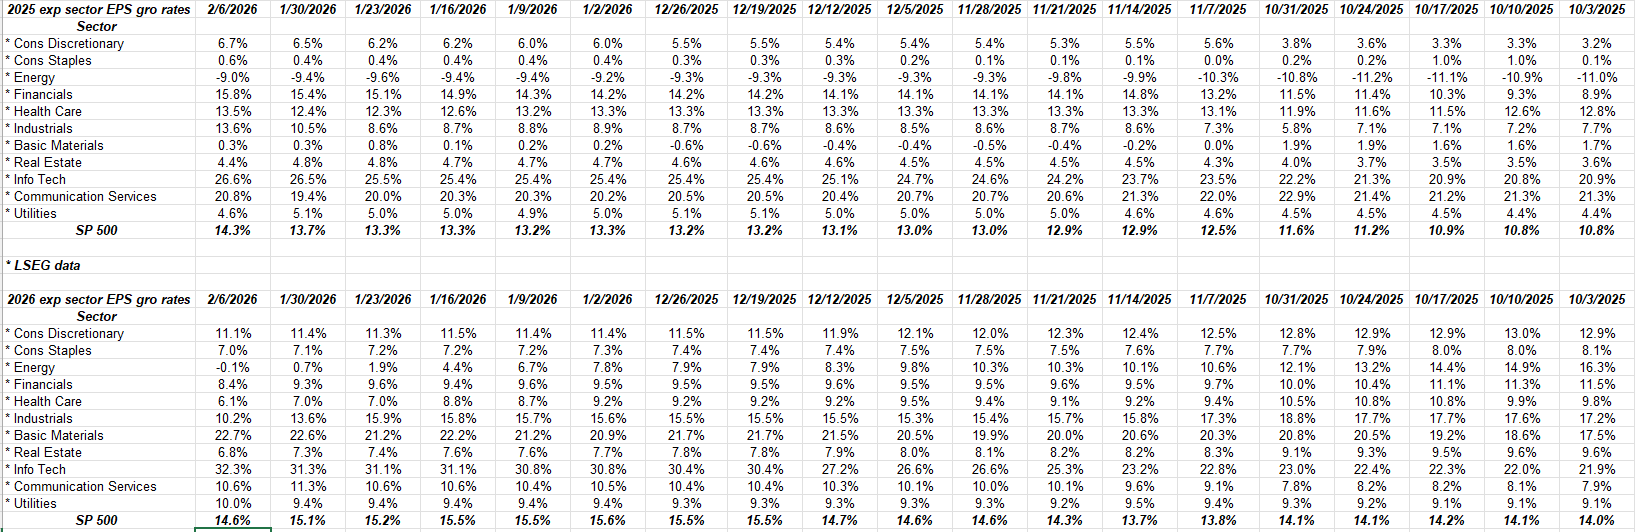
The top table above shows the weekly progression in expected EPS growths by sector for the SP 500.
Note that since the first week of October, 2025, the overall SP 500 expected EPS growth rate has risen from 10.8% on October 3 ’25, to 14.3% as of February 6 ’26, most of that improvement coming from technology, financials and industrials.
The expected growth rates by sector for 2026, tell a little different story: technology is still expected to grow 32.3% in 2026, but financials and industrials have been replaced by basic materials, and that’s about it.
The top 5 sector EPS growth rates in ’25 (with Q4 ’25 almost done reporting):
- Tech: +26.6%
- Communication services: +20.8%
- Financials: +15.8%
- Industrials: +13.6%
- HealthCare: +13.5%
Top 5 “expected” growth rates in ’26:
- Technology: +32.3%
- Basic Materials: +22.7%
- Consumer Discr: +11.1%
- Communication Serv: +10.6%
- Industrials: +10.2%
2026 is still based on management guidance coming out of earnings calls, so readers should expect to see revisions after Q1 ’26 is released in terms of analysts having greater confidence in 2026 EPS growth rates.
Japan election this weekend:
Japan Prime Minister Sanae Takachai dissolved the House of Representatives in late January, ’26, with snap elections to be held tomorrow, February 8th, 2026. With a mid-70% approval rating, the Prime Minister’s party is expected to win big, but there is still a lot of risk if Takachai should fail. (And that could be a problem, the fact that everyone expects a one-sided victory for Takachai.)
This blog is long EWJ or the iShares MSCI Japan ETF, which has many well known Japanese companies in the ETF. Obviously, there are other ETF’s and funds to get Japanese exposure, but that won’t be covered now.
The Nikkei and Japan gave some false hope to investors in the summer of 2013, that ultimately faded. David Herro of Oakmark International made a good call on that rally at the time, and it got some notable press in the financial media.
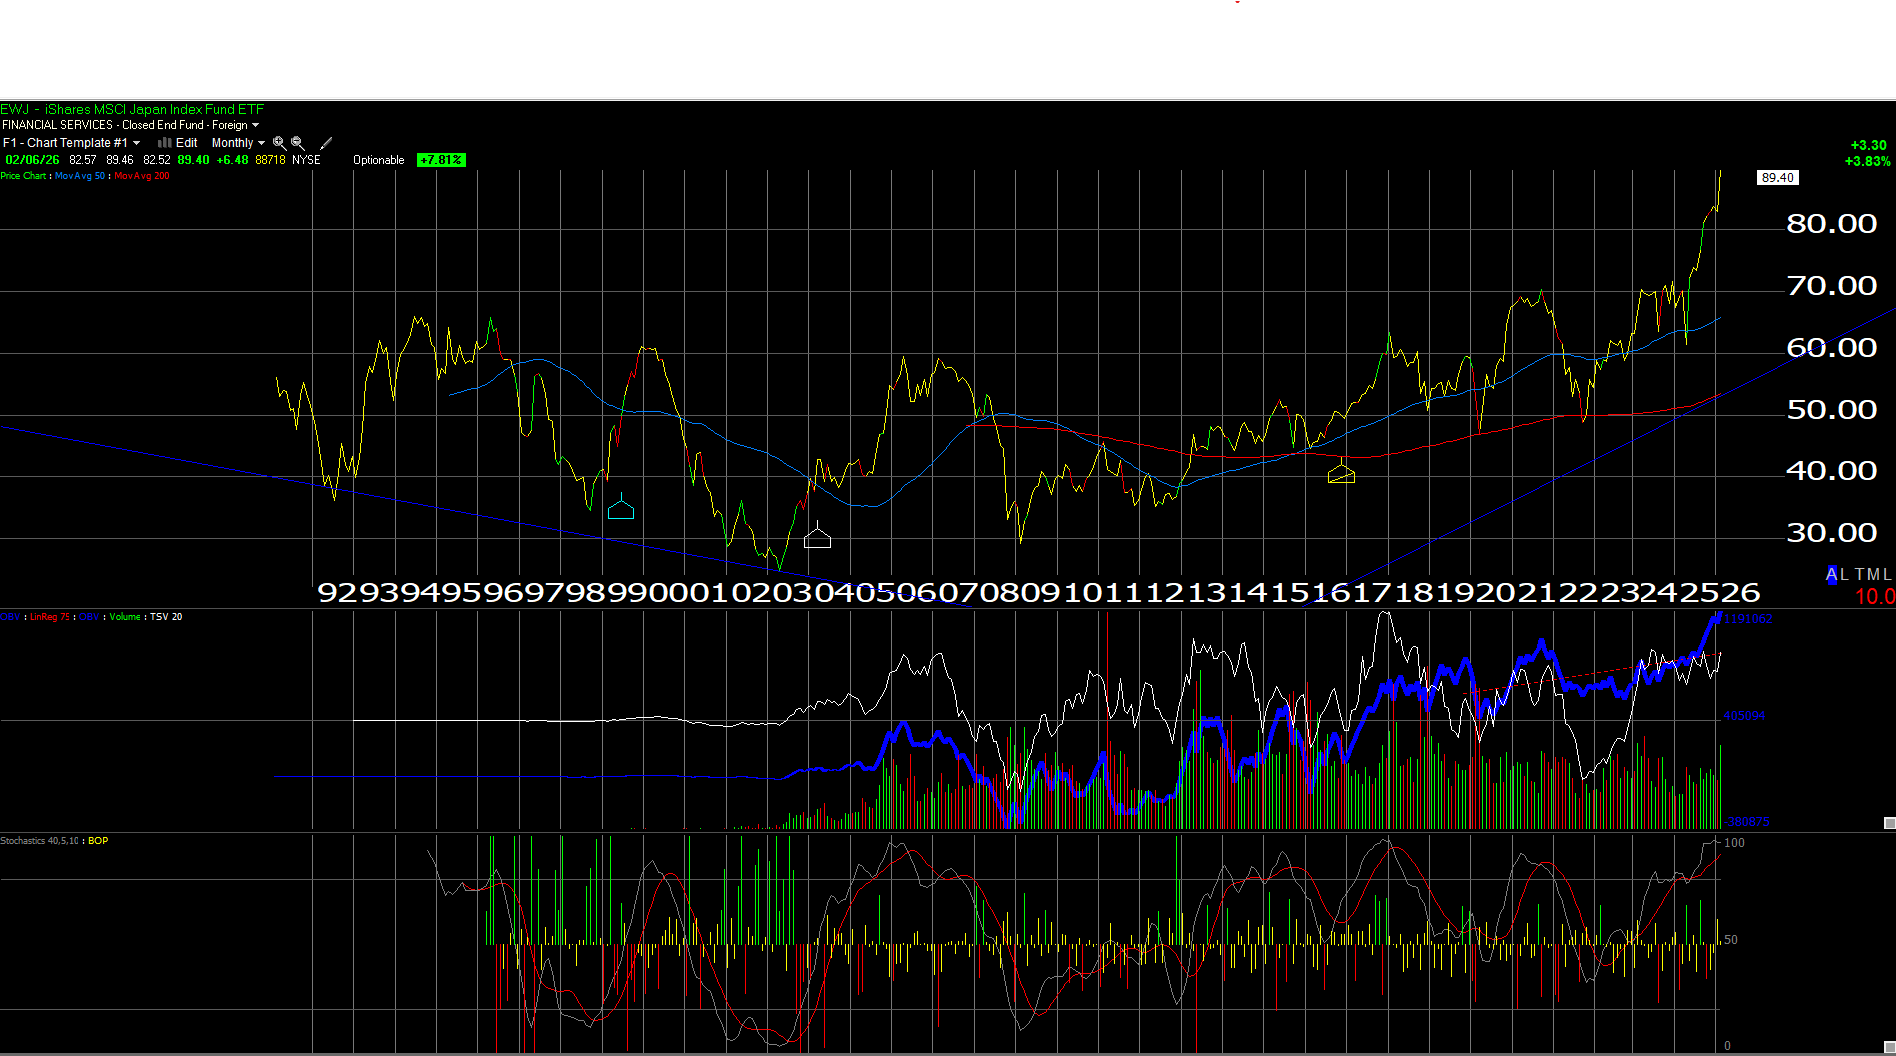
Above is a monthly chart of the EWJ, from it’s inception in February, 1991. The new all-time high in the EWJ to $70 in 2021, ultimately saw a reversal back down to the $50 area in 2022, both periods which coincided or correlated to US market strength and weakness thanks to zero interest rates from 2020 to early 2022, and then consistently-higher fed funds rate into 2022.
This latest rally in the EWJ since mid-2025, has been quite robust.
The yen has been significantly weaker versus the dollar in the last 12 months, even though the dollar has been weaker against a broader basket of currencies, over the same time period.
What’s the attraction of being long the EWJ or any Nikkei proxy ?
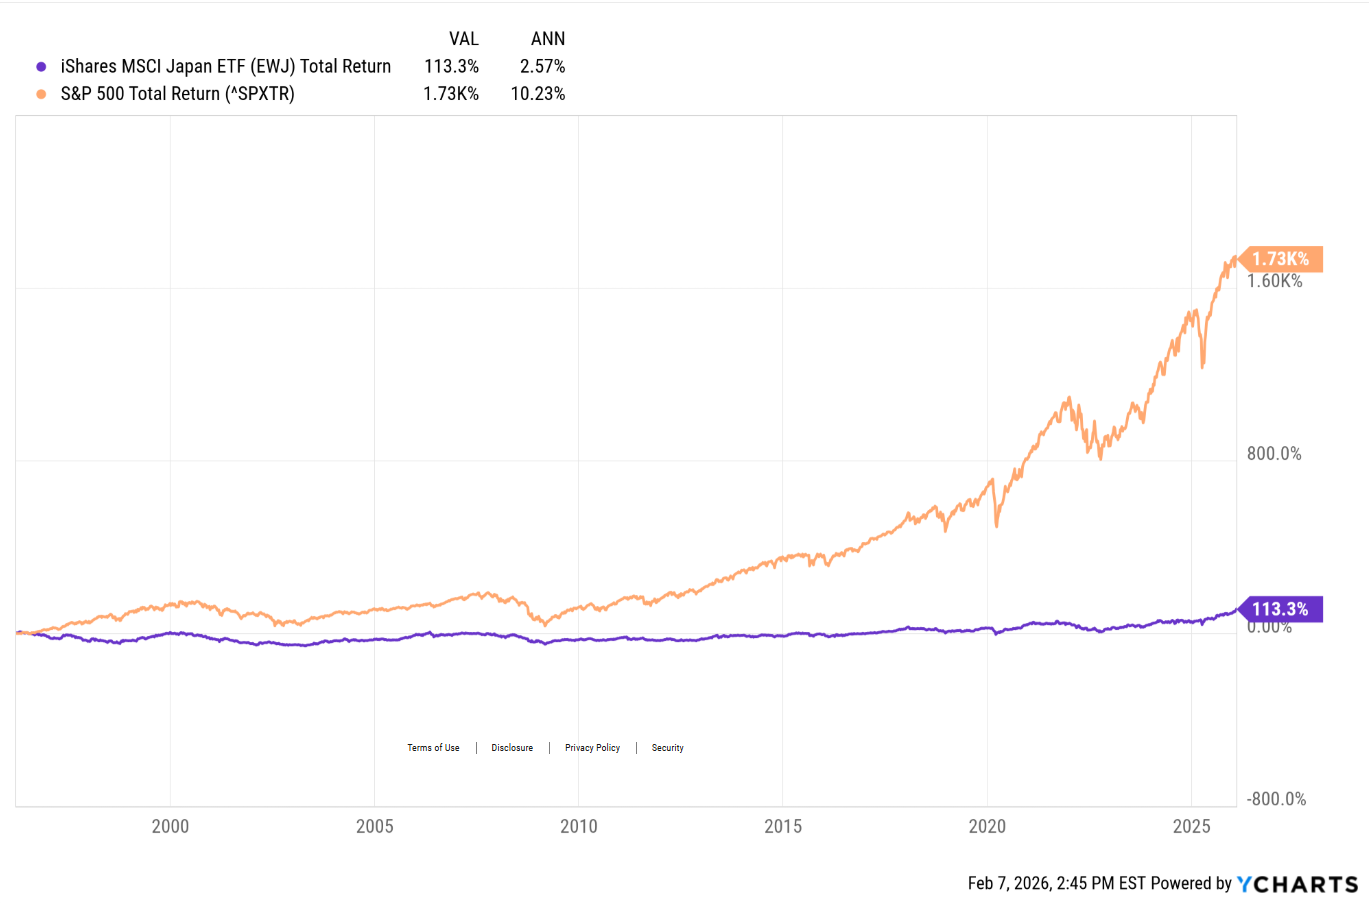
This performance chart showing the annual return of the EWJ versus the SP 500 total return from March 1, 1991 (not a typo) to February 6th, 2026, tells readers that the EWJ has given up 766 basis points a year (!) for the last 34 years.
With a secular bull market in the SP 500 that’s almost 18 years old, needless to say the EWJ and the Nikkei in general can be considered non-correlated assets.
This blog write twice about Japan in the 4th quarter of last year, both here and here, simply to force myself to start looking at any kind of Japan research from a fundamental perspective.
Japan’s bond market is now seeing interest rate levels not seen in decades. The 40-year deflation that gripped the Japanese economy that kept the country locked in a death grip seems to have finally ended. Prime Minister Takachai, who has expressed concern with China’s foreign policy, is expected to pull Japan closer to the US, and the current Administration. Also, the 20-year Japanese bond chart shows under 1% yield levels for most of last decade but now the 20-year Japanese bond is above 3%.
The “yen-carry” trade fears have also seemed to fade. Each time the media has raised fears about that trade wreaking havoc under higher interest rates, the fears faded once inflation and interest rates rose, and the Nikkei kept moving forward.
As a cautionary note, David Herro at Oakmark International (OAKIX) and the new Oakmark International ETF (OAKI), who was Morningstar’s portfolio manager of the decade from 2000 to 2009, is not expecting a big surge in the Japanese stock market or companies therein. David is an international large-cap value investor and is quite good at it, but he’s still subdued on forward, expected, returns for Japanese companies, probably for many reasons. (Investors and readers should be aware of David’s subdued expectations around Japan given his experience in international investing.)
Summary / conclusion: The SP 500 still cannot close above 7,000 on a weekly basis, even with Friday’s robust rally in the indices. The Dow crossing 50,000 sparked a lot of media interest in the index, even though less than 2% of the world’s investable assets are benchmarked against the Dow Jones Industrial Average. What I find more interesting is that the Dow is a price-weighted index, which typically means in bear markets for the market-cap weighted indices like the SP 500 and the Nasdaq, the Dow Jones Industrials will typically outperform and investors see much less downside. Look at how the DJIA performed versus the SP 500 and the Nasdaq from 2000 to 2009.
SP 500 earnings and revenue growth are still healthy and forward estimates don’t seem to indicate any slowing.
So why is the SP 500 having so much trouble punching through 7,000 ? Probably due to capex around AI. Capex doesn’t impact EPS, it impacts free-cash-flow. That means earnings estimates for the tech giants are still rising, while valuation(s), if measured by the discounted cash-flow (DCF) method are being pushed lower.
Japan could be interesting if the political will of the country can summon the courage to resist the forces that drove the country into a 35 – 40 year deflationary spiral.
None of this is advice or a recommendation, but only an opinion. And this blog claims no expertise on Japan, specifically. Past performance is no guarantee of future results. Readers should gauge their own comfort with portfolio volatility and adjust accordingly. None of this information may be updated and if updated, may not be done in a timely fashion.
Thanks for reading.
Blackrock has been overweight Japan for at least a year – “We are overweight. Strong nominal GDP,
healthy corporate capex and governance
reforms – such as the decline of crossshareholdings – all support equities. ”
They have maintained that shareholder reforms in combination with other macro factors favor Japan. They have maintained this from EWJ trading in high $50s.
Thanks, Philip. Didn’t know Blackrock had been bullish for so long. Appreciate the input.