Silver had an ugly day on Friday, January 30th. 500 ml shares traded versus an average of 78 ml, and the iShares Silver Trust (SLV) was down $30 or 28.6% on the day. The basic materials sector, of which silver, gold, copper and alumina companies are a part, is just 2% of the SP 500 by market cap.
So what’s happening with SP 500 earnings ?
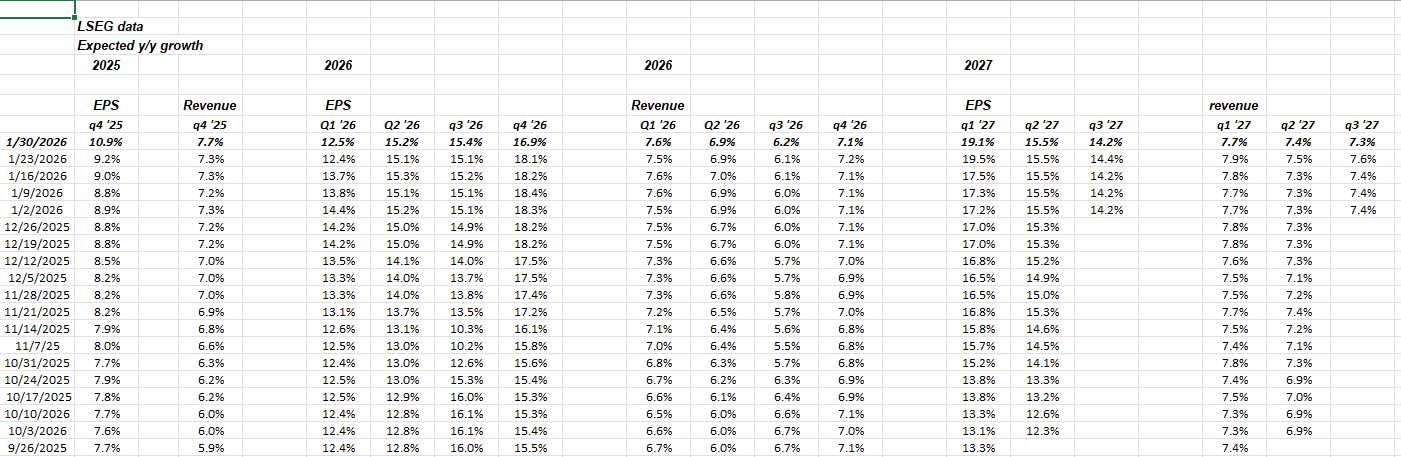
This spreadsheet layout (data from LSEG I/B/E/S) shows the steady progression of expected EPS growth rates, but also note expected revenue growth rates.
Expected EPS growth by sector:
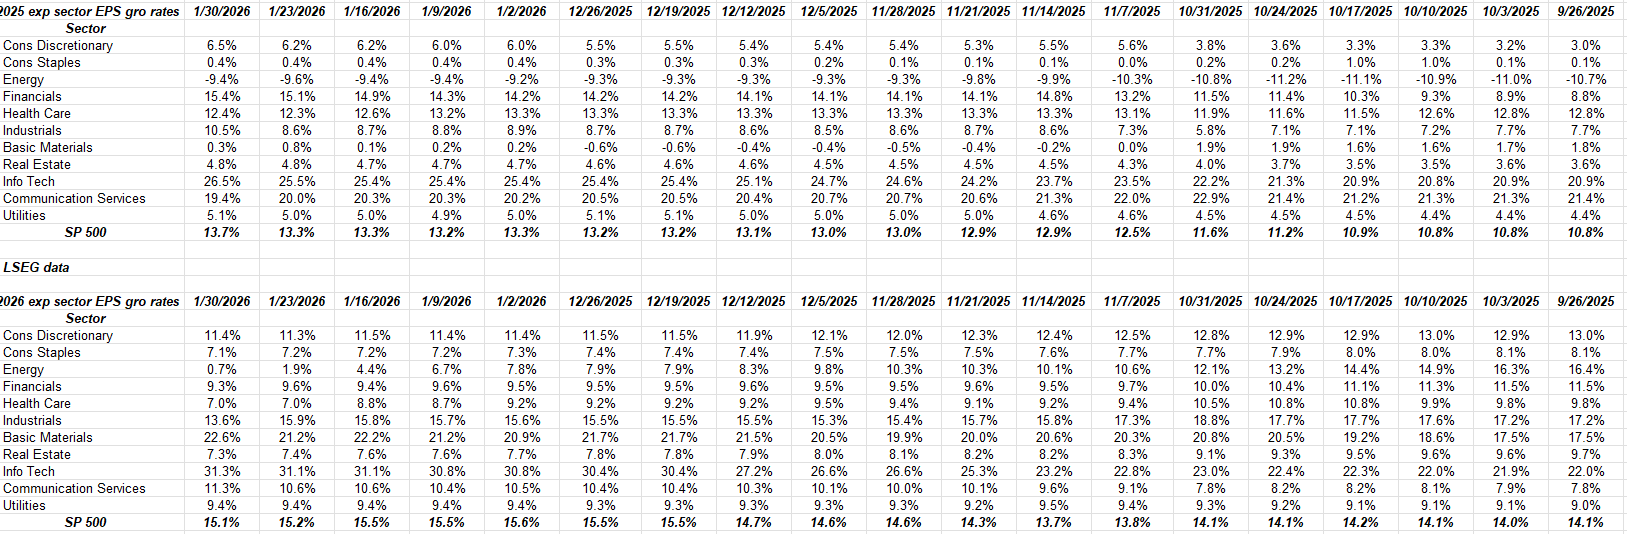
Looking at both 2025 and 2026, note the big change in basic materials EPS growth in 2026, as noted a week or two ago.
Note how the energy sector’s revisions for ’26 have been seeing downward pressure since late last summer. The sector is actually trading pretty well, and some of the charts show breakouts in the sector. Do you watch price or the earnings trends ?
Financials have been seeing lower revisions too for ’26, possibly thanks to the interest rate cap ?
Industrials too are seeing slowing growth rates for 2026.
This could change with first quarter reports that will start in April ’26.
Note too how the “expected” 2026 SP 500 EPS growth of 15.1% today was 15.5% – 15.6% in late December ’25, early ’26.
There has been some modest downward pressure on estimates after an unusually strong 6 to 9 month period.
Summary / conclusion: This blog has a ton of individual equity earnings previews or summaries (after-earnings look) to get to, so the weekly earnings update is just to show readers what the numbers say.
Here’s one last data point:
![]()
Expand the spreadsheet above, which shows weekly closes for the SP 500 since late October ’25.
The SP 500 is having trouble punching through 7,000. (The actual SP 500 close on 1/30/26 was 6,939 for the SP 500.)
Also, Microsoft’s drop on Thursday, January 29th, can’t be ignored. It was the worst day for the stock since the March, 2000, covid drop.
Looking at the expected EPS growth by sector above, 2026 technology sector EPS expected growth estimates continue to see higher expected EPS growth for technology for the first few weeks of 2026.
We’re in a gray area right now between estimates and price action.
None of this is advice or a recommendation but only an opinion. Past performance is no guarantee of future results. All SP 500 earnings data is typically sourced from LSEG I/B/E/S. None of the above information may be updated, and if updated, may not be done in a timely fashion. Readers and investors should determine their own comfort with portfolio volatility and adjust accordingly.
Thanks for reading.
Thank you, this is becoming my regular read now a days. On the declining 26 yoy, the 25 eps is still raising and putting pressure on 26 comps.
Thanks, Sreedhar p.