Pretty fascinating when large-cap growth and large-cap tech and mega-cap is your “contra” trade.
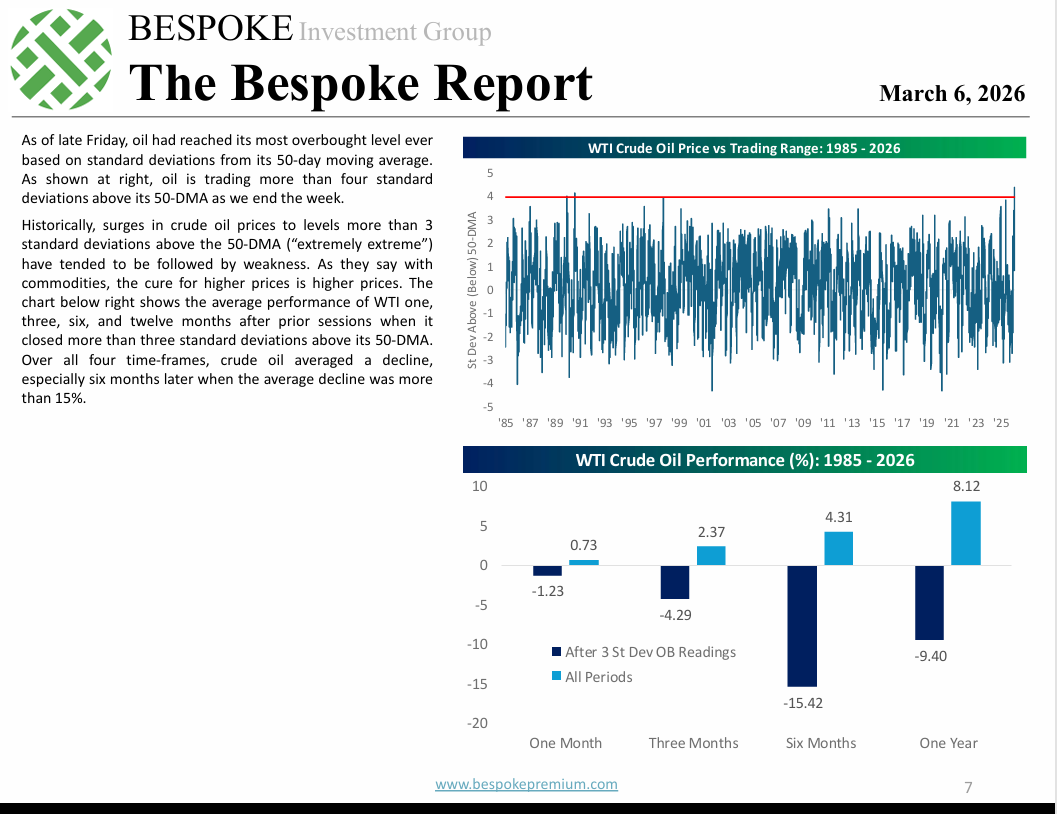
Interesting table from Bespoke this weekend showing that crude oil was more than 3 standard deviations above it’s 50-day moving average as of Friday, March 6th.
Thought I saw one chart in the early hours of Monday morning, showing crude oil spiked to $120 per barrel in overnight trading, which given the crude oil action as this is being written on Monday afternoon, and the above Bespoke chart, seems likely to indicate a near-term (or longer-term) peak for the price of crude oil.
Another contrarian signal is that the TLT (+20-year Treasury ETF) is up by +0.50% late Monday afternoon, March 9th, with 90 minutes left in trading.
SP 500 earnings update:
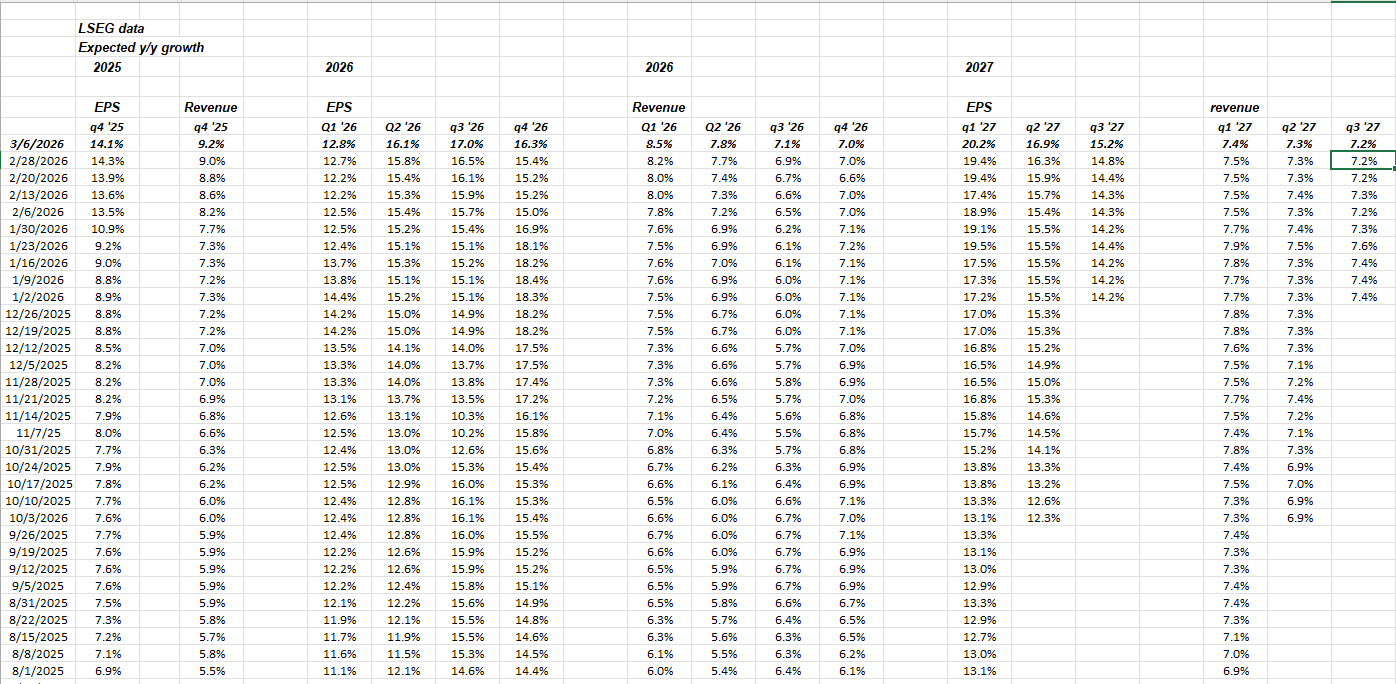
It requires a longer post but updating both the SP 500 EPS and revenue quarterly growth rates as of 3/6/26, shows no slowing of upward EPS revisions or revenue revisions.
What’s even more interesting, for Q1 ’26 sector EPS estimates, the energy sector was +1.3% sector EPS growth on Jan 1, ’26 but as of 3/6/26 the expected EPS growth rate had fallen to -9.3%.
This blog has never been a regular energy investor, choosing to put the research time and effort into other sectors, but I thought after the spike in crude oil last week, that the energy sector MIGHT start to see some upward revisions to EPS given the move in the sector so far in ’26.
Guess not. Maybe it’s a little early.
None of this is advice or a recommendation, but only an opinion. All SP 500 EPS and revenue estimate data is sourced from LSEG.
Thanks for reading.