When the new gets too good in the stock market, it can be as much of a warning sign, as an incentive to either equity allocations to float higher in client accounts to take advantage of bullish economic and corporate conditions, or trim positions and raise a little cash.
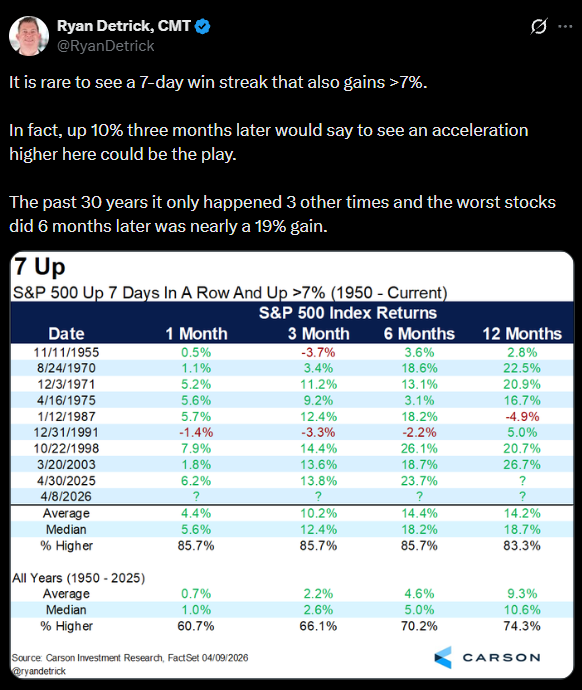
Here’s a good post from Ryan Detrick of Carson Group that shows the SP 500’s 7% jump in 7 days, and then “expected forward returns”.
The SP 500 is back to overbought already, but fundamentals remain pretty solid as the rest of this blog details (supporting the technical analysis).
Each week this blog updates SP 500 forward EPS estimates using LSEG data, which allows me to look at revisions to forward estimates and see which sectors might be safe place to allocate client funds, or a trim some gains from a particular sector.
Usually at this time of the quarter, with Q1 ’26 earnings just starting, SP 500 EPS watchers are seeing slightly negative or downward revisions to Q2, Q3, and Q4 numbers, as the tendency is to be cautious about the forward quarter’s as current results – in this case Q1 ’26 – reflect that conservatism and show an “upside surprise” to estimates. Particularly with Iran and it’s headlines, I thought some weakness would occur in the forward estimates, and so far that’s NOT been the case.
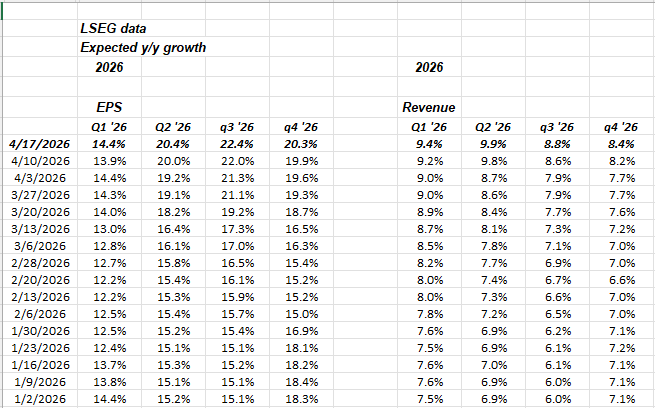
Q1 and Q2 ’26 expected SP 500 EPS growth, is still relatively flat with a slight positive bias, but look at Q3 ’26 expected EPS growth revision, to +22.4% today, versus the +14.4% on January 2nd, ’26. Tech peaked in late October ’25, but I can’t recall any particular damage to any sector that would have caused downward revisions to any particular sector or sectors in Q3 ’25, that would be have resulted in unusually easy compares for the SP 500.
So what is the market discounting in Q3 ’26 or are these just “bad numbers” from the Street ?
To try and get some educated estimate of what’s happening, let’s look at expected SP 500 revenue growth (in the above table, look at the last four columns, which shows expected SP 500 revenue growth by quarter in 2026):
Note the 200 bp acceleration for Q1 and Q2 ’26, which is a pretty healthy revision since, revenue “upside surprise” factors are typically 1% – 2.0%. Note also that expected revenue growth for the SP 500 in each quarter in 2026, is higher than the actual average revenue growth per quarter in 2025.
2025 actual revenue growth by the SP 500 “averaged” 7.2%. Here’s the progression by quarter in 2025 in terms of actual revenue growth:
- Q4 ’25: +9.2%
- Q3 ’25: +8.3%
- Q2 ’25: +6.4%
- Q1 ’25: +5.0%
What might be even more interesting, is that looking at actual revenue growth for the SP 500 by quarter, since Q4 ’12 (the first quarter this blog began tracking quarterly “actual” SP 500 EPS and revenue data) SP 500 revenue growth “averaged” +3.2% from Q4 ’12 to Q4 ’19. The strongest revenue quarters within that time period happened with the “Tax Cuts, Job Acts” passed in Q4 ’17. Here’s how those quarters tracked in terms of revenue growth:
- Q3 ’18: +8.6%
- Q2 ’18: +8.5%
- Q1 ’18: +8.4%
- Q4 ’17: +8.3%
Because these revenue growth rates are “post TCJA” and then after 2018 the revenue growth rate slows again into 2019 (and then we have the Covid mess), it’s easier to conclude that what we are seeing today in the SP 500 is probably considerably-aided by the “One Big Beautiful Bill” (OBBB) even in the face of tariffs of 2025, and now the crude oil shock of 2026.
The tech sector is expecting 27.1% revenue growth in Q1 ’26, along with expected 46% EPS growth.
To answer the above question about Q3 ’26 and potential bad numbers, Q3 ’26 might be lapping peak OBBB, or the 2025 tariffs, it might be an implied forecast for crude oil, and having it come down to the pre-Iran level of $67 per barrel (WTI).
SP 500 data:
- The forward 4-quarter estimate (FFQE) for the SP 500 rose this past week to $340.96 from $339.22 last week.
- The SP 500 PE on the forward estimate rose to 20.9x this week.
- The SP 500 “earnings yield” (SP EY) fell to 4.78% this past week, on the sharp bounce in the SP 500. The +5% EY yield in late March ’26 was a good tell for stocks, but I prefer not to make predictions around metrics such as this.
- While just 48 companies have reported their Q1 ’26 financial results so far, the EPS upside surprise is still quite healthy at 8.8%, while the SP 500 revenue upside surprise is also healthy at +2.2%. Another 94 companies are expected to report this week, per the LSEG report. “This Week in Earnings”.
Summary: Having tracked a lot of this data (from LSEG) from post-2008 until today, the remarkable aspect to this current period is the lack of any negativity or discouragement from analysts in terms seeing quarterly forward numbers taken down, as is usually the pattern.
Financials had a very good quarter last week. Some Citi (C) was added after their earnings release, while this blogs own enough of JPM already.
This week, earnings previews will be written on IBM and BA, two turnaround stocks. BA is struggling as they near peak revenue in 2018, and yet their margins and operating income and EPS are nowhere near records, which tells me that the FAA restriction on deliveries every quarter is keeping BA from leveraging the manufacturing base, but that what’s got them into trouble to begin with.
None of this is advice or a recommendation, but only an opinion. Past performance is no guarantee of future results. All EPS and revenue data is sourced from LSEG. Readers and clients should monitor their own comfort with portfolio volatility and adjust accordingly.