Walmart reported their fiscal Q1 ’27 financial results on May 21 ’26, with the retail giant reporting revenue better-than-expected by 2%, while EPS exactly met expectations. Operating income missed expectations by 1% which is the majority of the story for retailer.
The quarter was 5 out of 10 for Walmart, but in the overall picture wasn’t too bad, but coming into the quarter trading at 46x EPS (Walmart earnings preview), Walmart was due for a correction.
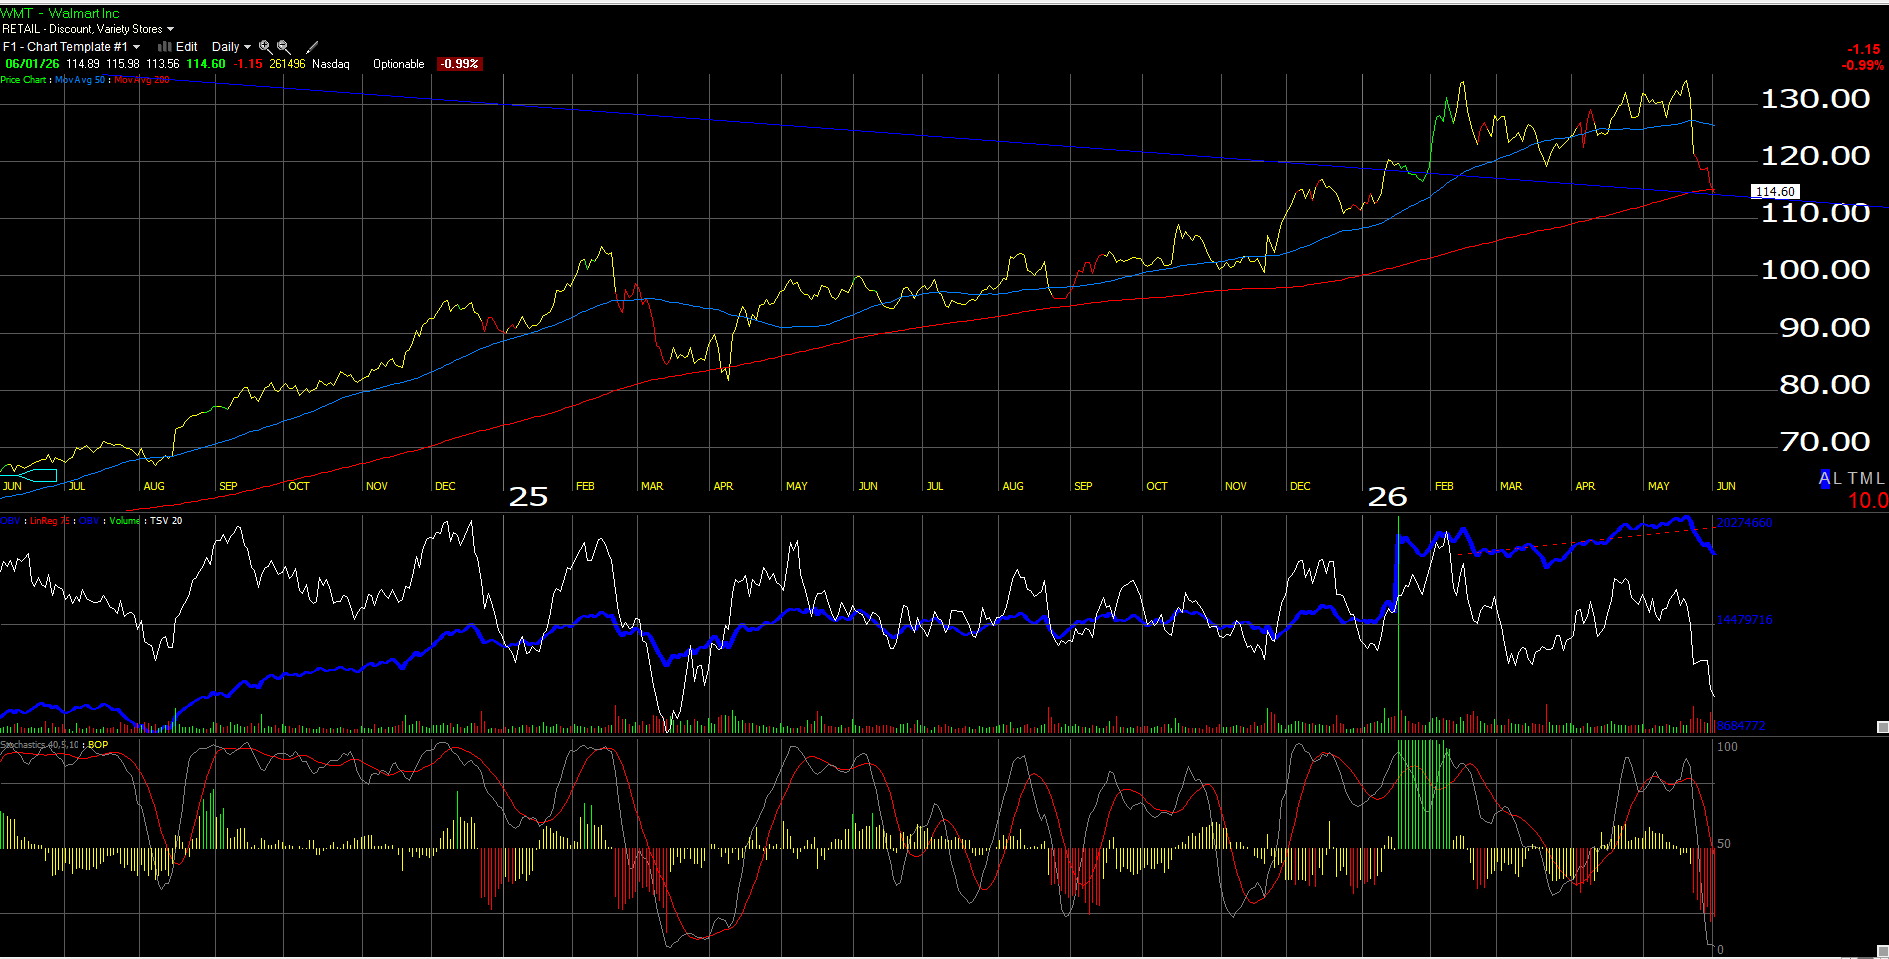
The above chart shows that Walmart’s stock has dropped from a high of $135 on May 19th to the close on June 1 ’26 of $114.60, just $0.40 below the 200-day moving average.
What was interesting about the quarter, is that “general merchandise” grew “mid-single-digits” (MSD), and led grocery for the first time in 5 years.
One Problem:
Since Walmart announced in the Spring of ’23 that all their fulfillment centers were going to be automated, and that the “flywheel” (advertising and digital growth), would assist in driving revenue growth in future quarters, operating margin has expanded but not nearly as much as I would have expected. Here’s the recent history of Walmart’s operating margin:
- 4-qtr avg: 4.53%
- 12-qtr avg: 4.40%
- 20-qtr avg: 4.27%
- 40-tr avg: 4.29%
Walmart’s operating margin was between 5% – 5.5% for the first part of last decade from 2010 to 2015, 2016, and then fell in the 2nd half of the decade back down to the 4.5% range (and even under 4% in 2018), and since then Walmart has struggled to increase the key metric.
Personally, I thought recent advertising growth would be a “margin-rich” new revenue line item, along with digital and membership, not to mention Walmart’s continuing improvement in e-commerce, pushing the operating margin consistently into the 5% and 5.5% range, but that hasn’t yet been the case.
Even at $114 per share, Walmart is still trading at 39x expected ’27 EPS on a current 10% expected growth rate (EPS and revenue growth for fiscal ’27 ends January ’27) with both remaining at 10% and 5% respectively, since the previous quarter. Since the roughly 11,000 stores Walmart owns throws off considerable depreciation expense (a non-cash expense), Walmart’s price-to-cash-flow ($5.11 per share) at $114 is 22x, versus the PE multiple.
Quick summary:
One of the hidden stories in the last few years within the Walmart story is the improvement in Sam’s, as well as the growth in advertising and e-commerce and digital and membership components within revenue, but investors still do not see the consistent improvement in the operating margin.
One pleasant surprise in this last quarter was the hefty revisions in forward revenue estimates, which counters the popular argument currently that the US consumer is “pressured” thanks to higher oil prices. Walmart is expected to print over $750.5 billion in revenue in fiscal ’27, so to see that revenue estimate get revised higher from $747.7 billion in revenue last quarter, was a positive for the story.
Walmart is still America’s biggest retailer. Amazon has greater revenue, but you have to remove Amazon Web Services (AWS) from the expected revenue estimate for Amazon in calendar 26 to get to Amazon’s “retail” part of the business. If we assume that AWS does $150 bl in revenue in calendar ’26 (and that’s probably light), with the current total Amazon revenue estimate for calendar ’26 (as of the last earnings report) of $823.4 billion, then the retail part of Amazon is approximately 82% of total revenue.
Walmart’s big strategic competitive advantage in the dog fight with Amazon, is that Amazon is struggling with grocery, while Amazon closed their Amazon Fresh stores and AmazonGo stores recently and decided upon the Whole Foods acquisition to fulfill their growing grocery business. Given 60% – 65% of Walmart’s revenue is grocery, Amazon has a considerable challenge to close the market share gap within grocery that Walmart holds.
To be blunt, Walmart’s grocery business will likely remain a sustainable competitive advantage – vs. Amazon – for years.
In a market consumed with all-things tech, don’t forget the basic businesses like retail and grocery.
None of this is advice or a recommendation but only an opinion. Past performance is no guarantee of future results. All PE and revenue estimates are courtesy of LSEG. None of this information may be updated, and if updated may not be done in a timely fashion. Readers and clients should evaluate their own comfort with market volatility and adjust accordingly.
Thanks for reading.