In the late 1990’s there was always one or two financial press commentators, and even a few investment advisors suggesting that the 60% SP 500 / 40% Barclays Aggregate (AGG) had outrun it’s usefulness, and suggested alternative allocations for investors.
You are hearing the same thing today on a number of fronts from either investment advisors (and occasionally the press) again today, after 18 years of a secular equity bull market.
My own discussion with clients is really about staying the 60% / 40% course, and not deviating too much from accepted custom, or the prudent man rule.
What’s driving the renewed discussions around 60% / 40% is not just the bullish equity market returns since March 9, 2009, but the rather paltry bond market returns since the ZIRP (zero interest rate policy) of 2020 and 2021.
Harry Markowitz, the famed University of Chicago professor who developed MPT (Modern Portfolio Theory) back in the 1950’s and 1960’s, saw the 60% / 40% model balanced portfolio allocation evolve from the MPT work, or efficient market theory.
The problem is the “bond market” back in the 1950’s and 1960’s was nothing like the bond market today, with high-yield corporate credit, mortgages (MBS), agency credits, and the latest evolution, private credit allocations being introduced and becoming material fixed-income segments within the overall bond market over the last 60 years.
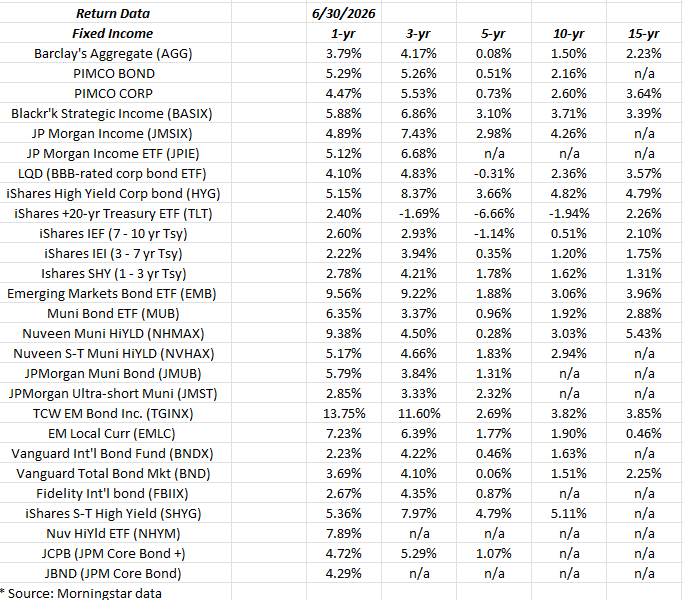
This above spreadsheet was started during COVID to assemble various bond market asset classes in order to track “annual returns” for various fixed-income asset classes over longer periods of time.
As of June 30 ’26, YTD returns on bond-market asset classes (not shown) are pretty paltry, mostly ranging from 0% to 3%, but the 1-year returns – as noted above – are much better (with the possible exception of the Treasury complex), with the with the total-return leaders being non-US fixed-income, emerging market fixed income, corporate high-yield, and even municipal high-yield.
In the face of 4 years of consecutive SP 500 returns where the calendar years returns for the SP 500 were +25% (2023), +25% (2024), 17% (2025) and now in 2026, where the June 30, ’26 YTD return for the key benchmark is +10%, the bond market looks remarkably boring and uninteresting.
But that’s typically when you need it.
The Barclays Aggregate (AGG) has become “Treasury-heavy” thanks to the US deficit increasing the share of Treasuries as a percentage of the investable bond market, but it’s still used in client accounts to avoid becoming too corporate credit-laden, and to get total return when periods like “Liberation Day” reared it’s head, from early January to early April ’25, when total returns on the AGG and the TLT jumped to +3.64% (+14.86% avg annual return) and +7.42% (+32% avg annual return), so the AGG and the TLT can offer total return and a portfolio buffer in times of equity market stress and duress.
In 2022, when the Fed raised rates from early 2022, the AGG outperformed the SP 500 through the first 6 months of 2022, in what turned out to be one of the worst years for bonds / fixed-income returns in 30 years, although the TLT lagged the SP 500 through the first 6 months of the year.
Years ago, Morningstar published “standard deviation” metrics for stock and bond asset classes, and the “20%” standard deviation for the SP 500 was widely disclosed to retail investors, although individual investors might not have known it means for an ordinary portfolio. Just from an ordinary Google search today, readers can see the “annualized” standard deviation estimate for the SP 500 is 15% – 18% while the Barclays Aggregate’s annualized standard deviation estimate is 5% – 7%, which is probably a little elevated after 2022.
When you get through all the historical statistics, all this means is that a diversified bond / fixed-income portfolio is typically much less volatile over short and longer periods of time, and provide less downside risk for individual investors, with certain notable exceptions like long-maturity Treasuries.
Summary: The “40%” of the long-held asset allocation standard of “60% SP 500 / 40% Barclays Aggregate” is still a necessary component for many individual investors, which is always dependent upon the personal situation. But one trait about individual investors is that they tend to become more bullish during longer equity bull markets, and far less bullish during certain periods like the early 2000’s when the SP 500 saw a 50% correction for the first time since 1973 – 1974. The Nasdaq fell 80% from the March, 2000, peak to the lows in July through October ’02, so you can imagine the angst at that point.
In other words, as has long been written about, individual investor sentiment is a typically-contrarian indicator.
Over the years, various derivations to the 60% / 40% have been utilized by larger institutions, such as having a short position that consumes a certain percentage of the 60% / 40% standard, but it was never employed for client accounts.
As a final note, just as this blog post was being written on Sunday, July 5th, 2026, a headline popped up from Morningstar, displaying an article from Amy Arnott dated, June 30, ’26 and talking about the prospect of a “lost decade” for stock returns, like we saw from 2000 to 2009.
![]()
Thoughtful discussions about the validity of the standard 60% / 40% portfolio for managing money will likely go on for years, long after dirt has been thrown on top of this blog, but it’s the severity of the ultimate bear market, not necessarily it’s frequency (last paragraph in the Arnott article above) that can make clients exceedingly anxious.
By the way, Amy suggests that to mitigate the prospect of a “lost decade” utilize balanced portfolios, and set realistic withdrawal rates.
None of this is advice or a recommendation but only an opinion. Past performance is no guarantee of future results. An 18-year secular bull market stimulates many forms of discussions for investors. Readers, clients, and all forms of investors should adopt a measured approach when bull (and bear) markets start to get long in the tooth. Readers and clients should determine their own comfort levels around portfolio volatility and adjust accordingly.
Thanks for reading.