Most of the fixed-income returns that are tracked on a weekly basis by this blog, ended higher on the week, despite all the chatter around Kevin Warsh and the latest Fed meeting. There just seems to be an undue amount of bearishness (i.e. higher bond yields and lower prices) discounted in Treasuries, and high-grade corporates, etc., as of this week’s meeting.
SP 500 data:
- With just 10 days left in the quarter, just to update the numbers, the SP 500’s “forward 4-quarter estimate) as of this week, was $352.62, up from $352.06 the prior week and up from $338 at the start of the quarter.
- The PE on the forward estimate is 21.3x, up from 19.5x the first week of April ’26 so contrary to popular financial commentary, SP 500 investors have seen a little PE expansion in the last 10 – 11 weeks.
- The SP 500 earnings yield (SP EY) ended last week at 4.70%, still very reasonable in terms of the SP 500’s valuation, relative to the 4.3% in mid to late 2025. (Some of this is the one-time gains in Amazon’s, Alphabet’s, Netflix’s and META’s numbers as of Q1 ’26, so take the SP EY, with a minor grain of salt.)
- The SP 500 EPS upside surprise for 1st quarter, ’26 earnings is +8.2%, which has been relatively unchanged since the first week of May, while the SP 500 revenue upside surprise is +2.2% also “unch’ed” for the majority of the Q1`26 earnings season.
Micron Tech:
All eyes will be focused on the fiscal Q3 ’26 Micron Technology (MU) results that are scheduled to be released after the market closes on Wednesday, June 25th, 2026.
Analyst consensus for the Wednesday night, June 25th report, per the LSEG estimates today:
- MU revenue: $35.4 billion for 281% y-o-y growth
- MU operating inc: $27.6 billion vs $2.2 bl last year for a 1000% increase y-o-y growth
- MU EPS: $20.47 for 972% y-o-y growth.
(These estimates could change slightly before Wednesday night’s earnings release.)
In Micron’s fiscal Q2 ’26, which was reported last March – after DRAM and NAND prices rose 140% and 170% respectively – MU reported 196% y-o-y growth, 720% y-o-y growth and 682% y-o-y growth for revenue, operating income and EPS, respectively.
For fiscal Q4, which for MU ends August 31 ’26, the consensus is expecting:
- MU revenue: $42.5 billion
- MU operating inc: $34.1 bl
- MU EPS: $25.13
Any lowering of guidance for the fiscal Q4 ’26 numbers will likely not be treated well by shareholders, and that’s not a suggestion. The revisions below obviously don’t expect that.
These compares get tough in fiscal 2027.
Much like the late 1990’s, MU is in the sweetest part of the memory cycle right now and they are well-positioned for it.
Micron EPS revisions:
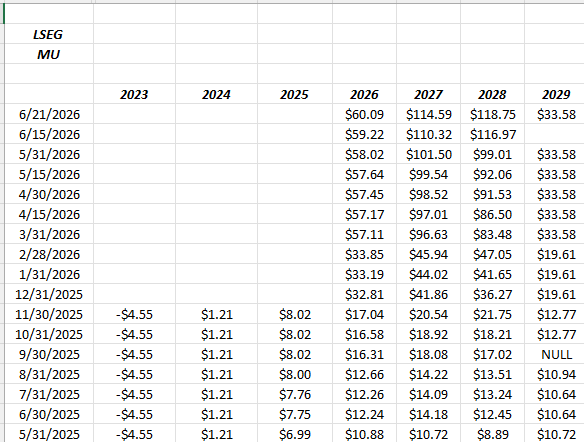
This EPS estimate revision tracker is perfect for “momentum” stocks like MU and others. Note the increase in fiscal ’26 EPS between February ’28, 2026, and March 31, 2026. That was the fiscal Q2 earnings release and the subsequent EPS revision following the release.
The 2029 estimated EPS is not yet a “valid” EPS estimate since – on the part of the spreadsheet not seen by readers – there are only two estimates currently for Micron’s fiscal ’29 results.
That being said, the EPS and revenue estimates can fall that quickly.
If past is prologue, aka 1999 and 2000 – the stock will start to fall long before the consensus estimates get revised lower.
Micron revenue revisions:
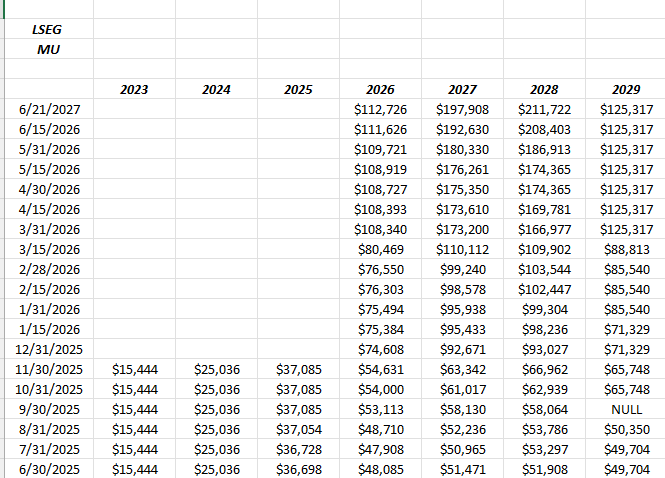
It’s a similar story for MU revenue estimates, just not to the degree of revisions as EPS.
Ultimately, the “story” on Micron and the semiconductor sector is the memory cycle, which is full-swing thanks to AI and the capex build-out, although MU specifically is about “operating leverage” and the incredibly sharp change in EPS and cash-flow, for a given change in revenue. It’s the same thing all high fixed costs businesses struggle with, since the down cycle tends to lose more money, than was made during the upswing.
Micron’s gross margin was negative for all of calendar ’23, but is now 75% as of the February ’26 quarter.
![]()
Clicking on the above spreadsheet, shows Micron’s margin history from the last quarter back through Nov ’21. Just in the last 5 years MU has seen a cycle that saw the stock peak near $100 in early ’22, and then be down 50% to the high $40’s by year-end and then went through another 4 quarters where all margins were negative (even gross margin).
This blog owns no Micron for client accounts, and no semiconductor stocks, other than what is held in the emerging markets ETF’s. The (EMXC) IShares Emerging Markets (ex-China) which is widely held in client accounts has 37% of it’s portfolio – the top 3 names – in semi stocks, which Taiwan Semi (TSMC), Samsung and Hynix. The Taiwan dollar and the South Korean won are 8 of the top 10 currencies in the EMXC ETF. (Even that is making me nervous.)
If the late 1990’s are any analog, beware the downside in semi’s when the cycle changes, and for Micron it’s particularly pronounced. Although MU has just $1 billion in term debt outstanding, if this cycle were “different” and the Micron the company had changed, it would likely have a higher credit rating than the Standard & Poors BBB (senior unsecured) credit rating, along with Moody’s Baa2 implied senior unsecured rating.
It’s not a shot at Micron and its management team, but MU – during down cycles – has endured long periods where it’s never earned it’s cost of capital.
Just know what you own and “caveat emptor”.
Conclusion: FedEx (FDX) reports this coming week as well, and the similarities between FedEx and Micron are not as great as you’d think. Both businesses have a higher degree of operating leverage and both businesses require that volume, – and even better is gradually higher volume – occur over the fixed cost base to drive higher operating profit and cash-flow.
As the 2nd quarter, 2026 wraps up, it’s been an amazing SP 500 earnings period, although there continues to be considerable value (in my opinion) in the other sectors of the SP 500 that are not technology.
None of this is advice or a recommendation, but only an opinion. Past performance is no guarantee of future results. All EPS and revenue data as well as estimate data is sourced from LSEG. Clients should gauge their own comfort with portfolio volatility and adjust accordingly.