After this weekly earnings update for the SP 500, as we end Q1 ’26, and are about to begin Q2 ’26, this blog will have a Micron Tech (MU) earnings summary – what an unbelievable quarter for the memory giant – and a preview of Nike’s fiscal Q4 ’26 earnings, which are slated to be released on Tuesday, June 13th, 2026, after the closing bell. More to come this weekend…
SP 500 data:
- The forward 4-quarter SP 500 EPS estimate (FFQE) rose again this week to $353.22, from last week’s $352.62, and the start of the quarter’s $338.29.
- The PE on this week’s FFQE is 20.8, vs last week’s 21.3x.
- With the -0.80% decline in the SP 500 this week, the SP 500 earnings yield (SP EY), jumped to 4.80% vs last week’s 4.70%. That 4.80% SP EY is close to the 5% level, which is where the SP 500 bottomed in late March, 2026.
- With the bulk of SP 500 earnings having been reported since the 3rd week of May ’26 (Walmart’s report), the upside surprises or beat rates for the SP 500 EPS and the SP revenue estimates, remain unchanged at +8% and +2.2% respectively. Amazed that Micron’s EPS and revenue beat didn’t move the needle for the benchmark.
- High yield credit spreads – at least the two metrics this blog follows from Bespoke’s Morning Lineup – rose slightly this week. The average high yield credit spread rose to +276 this week vs +271 last week.
SP 500 EPS and revenue, estimated quarterly growth rates
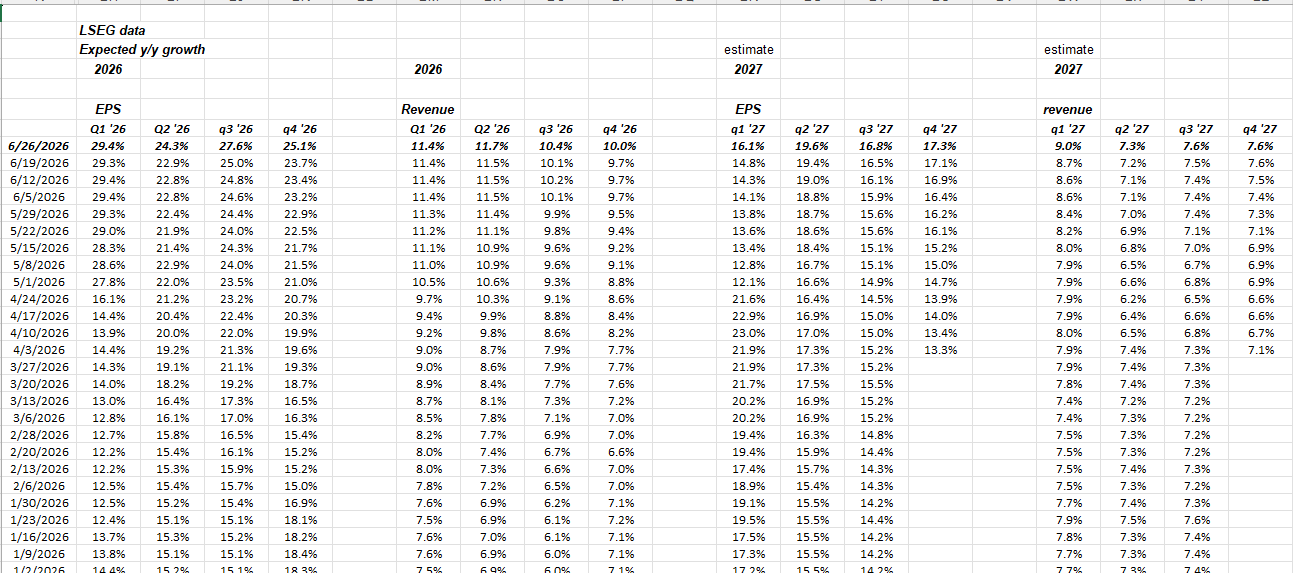
This is LSEG data from the weekly Earnings Scorecard, which I like to show readers since it gives a sweeping look at the next 7 quarters (through Q4 2007) for the “expected” SP 500 EPS and revenue growth rates.
Click on the spreadsheet to enlarge it. Q2 ’26 quarterly financial results start the week of Monday, July 13th,. 2026.
A couple of points to note from the above data:
- Q1 ’26 SP 500 EPS doubled from it’s expected +14.4% growth rate on April 3rd ’26 to the June 26th week’s EPS growth rate of +29.4%.
- SP 500 revenue didn’t increase nearly as much, from an expected +9.4% on April 3rd to +11.4% as of June 26th, but that is to be expected.
- NOTE (!) how Q2 ’26’s expected SP 500 EPS growth is starting the quarter at +24%, much higher than Q1 ’26.
- One-time gains in Q1 ’26 SP 500 from Antropic mark-ups and Netflix’s one-time merger termination fee look to have added 5% – 8% to SP 500 EPS growth for that quarter.
Are these quarterly expected growth rates for EPS (and revenue) to some extent even sustainable ? The energy sector is expected to grow EPS +118% y-o-y in Q2 ’26, all of which is obviously pre-Iran. But with crude oil back below $70, the forward quarters will likely start to build in lower y-o-y growth rates for the sector. Energy is only 3% of the SP 500’s market cap weight today, versus 14% – 15% in September, 2014.
How have full-year 2026 SP 500 EPS estimates changed ?
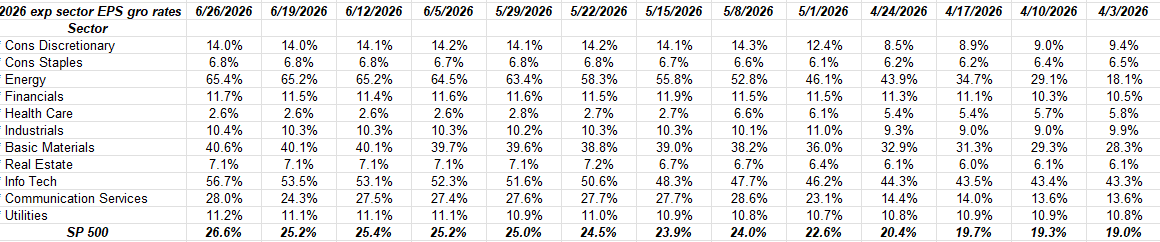
Clicking and expanding the above spreadsheet, readers can see the growth in the technology, communication services and the consumer discretionary sectors since early April ’26.
Last 5 quarters, growth rates by sector:
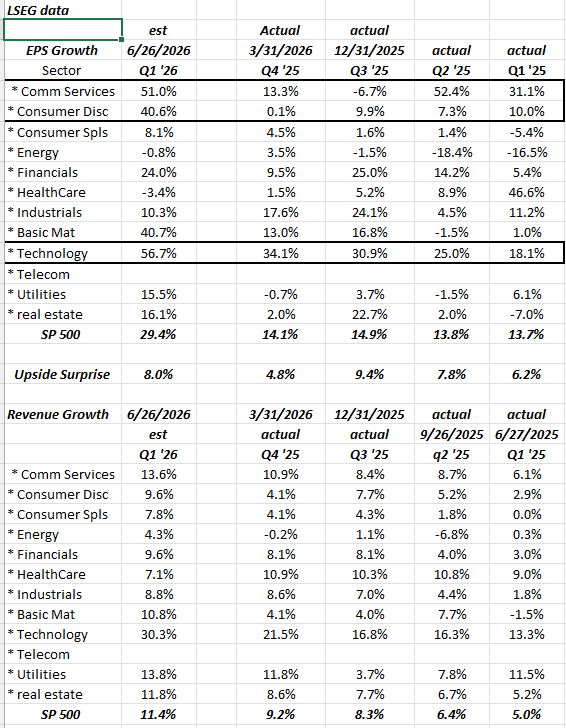
This spreadsheet shows the last 5 quarters and the improvement in technology EPS (and communication services and cons discretionary) since Q1 ’25.
These compares are going to get tougher in the back half of ’26 and just think about what 2027 will look like trying to “lap” Q1 ’26.
Conclusion: If someone managing money in the 1960’s and 1970’s, and then was dropped into the 1980’s and 1990’s and looking at the technology sector, the growth in earnings would be truly hard to digest given the decades prior, and it looks like we are repeating the exact same pattern in the 2020’s.
Personally, I have a tough time thinking these tech sector growth rates (and the “tech sector” is – for the most part – now consumer discretionary, and communication services, separated from tech late last decade) are sustainable, for any length of time that aren’t really appropriate for hedge funds, and active managers with high turnover.
The last time we saw these expected growth rates was when interest rates were zero, i.e. after Covid.
None of this is advice or a recommendation, but only an opinion. Past performance is no guarantee of future results.
Thanks for reading.