
Everyone talks about SP 500 EPS growth, but few pay attention to S&P 500 revenue growth, which may be a better indicator of the market’s health.
The last time both the SP 500 EPS and revenue growth (y-o-y) were this strong was Q2 ’21 (smack in the middle of COVID), when the SP 500 EPS/ revenue growth y-o-y was 96.3% and 26.2% respectively, and the only reason those growth rates were that strong was zero interest rates for 2 years after the onset of COVID.
For comparison purposes, Q2 ’20 EPS and revenue growth for the SP 500 was -30.6% and -8.7% respectively.
For Q2 ’26 to-date, SP 500 EPS and revenue growth are up 51.1% and 15.2% respectively, and yes, the SP 500 EPS growth has been inflated the last two quarters by the Anthropic mark-ups. LSEG’s TJ Dhillon notes that – after adjusting or excluding for the Alphabet and Amazon Anthropic mark-ups – EPS growth for Q2 ’26 is 32.7% versus the published 51.5% figure, while Q1 ’26’s adjustment was 7%, (again, both Amazon and Alphabet), on a stated EPS growth in Q1 ’26 of 26%.
So the SP 500 “operating” EPS growth rates the last two quarters are 19% – 20%, and 32.7%.
Looking at longer-term revenue estimates for the SP 500’s y-o-y revenue growth rate, Q2 ’26 was estimated at 6.9% on January 2nd ’26, while Q2 ’26’s almost-completed revenue growth (with the quarterly reports being almost complete with 436 companies having reported to-date), is 15.2% or twice what was expected January 2, ’26.
That is strong revenue growth.
From Q4 ’12 through Q4 ’19, (almost the entire decade post-2008), the strongest quarterly, y-o-y, rate of revenue growth for the SP 500 was 8.4% in 2018, and that could have been aided by the TC&JA.
Speaking of which, the OBBB (One Big Beautiful Bill) was signed into law on July 4th, 2025 by the President. Starting with Q3 ’26 and each quarter beyond, we could likely see progressively less OBBB stimulus, as we lap the OBBB-influenced quarters. Something similar was seen with the TC&JA in the late part of last decade.
Amazon’s earnings report:
Like the Alphabet (GOOGL) earnings report of a few weeks ago, Amazon’s latest earnings release was heavily effected by the Anthropic write-up: after removing the EPS value of the Anthropic mark-up, I have that Amazon missed on their EPS by 55%, printing operating EPS of $0.86 versus the $1.92 expected by the Street. However, after vetting all the research, I couldn’t find any sell-side analysts adjusting the number for the $4.89 Anthropic mark-up.
Most of the sell-side commentary seemed to treat the mark-up as operating.
Amazon’s Amazon Web Services (AWS) was the hero of the quarter, despite Anthropic. AWS grew revenue 37% y-o-y the strongest in quite a while (since COVID or March, ’22) for the combination e-commerce retailer and cloud company. One sell-side note, did say that the retail business saw a 9% operating margin, versus WMT’s operating margin of 4.3% last quarter. Walmart will report their July ’26 quarter in two weeks, and the brick-and-mortar giant has done a good job adding the “fly wheel” to their revenue options, but even with all the supply-chain improvements and the advertising revenue, etc. Walmart’s operating margin hasn’t moved much.
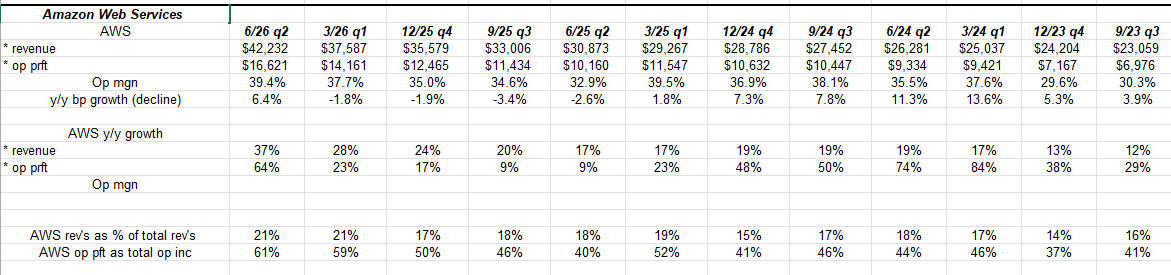
Here’s a quick look at the trends in Amazon’s AWS business. AWS’s operating margin rose 640 bp’s y-o-y in the quarter just reported.
AWS is now 61% of total Amazon’s operating income, versus 21% of total revenue.
Amazon’s free-cash-flow has been negative for the last two quarters and capex now exceeds operating-cash-flow, but that hasn’t seemed to matter.
Looking at Amazon’s technical chart, the stock looks poised for a breakout here, if the stock can clear $275 – $277.
Summary of today’s blog post: It was tough not to think that these quarterly earnings season in 2026, represented some type of “peak EPS and revenue” for the SP 500 but looking at the numbers, but that conclusion could be wrong too, given below.
When Q1 ’26’s earnings season saw Anthropic mark-ups, LSEG immediately reduced the Q1 ’27 quarterly, expected SP 500 EPS growth from 21.4% on April 24th, ’26 to 12.1% on May 1 ’26. Today, that 12.1% is rising again to 17.7% of this weekend.
Now Q2 ’27 was cut to 1% as an expected quarterly EPS growth rate for Q2 ’27, down from 20% expected 5 weeks ago.
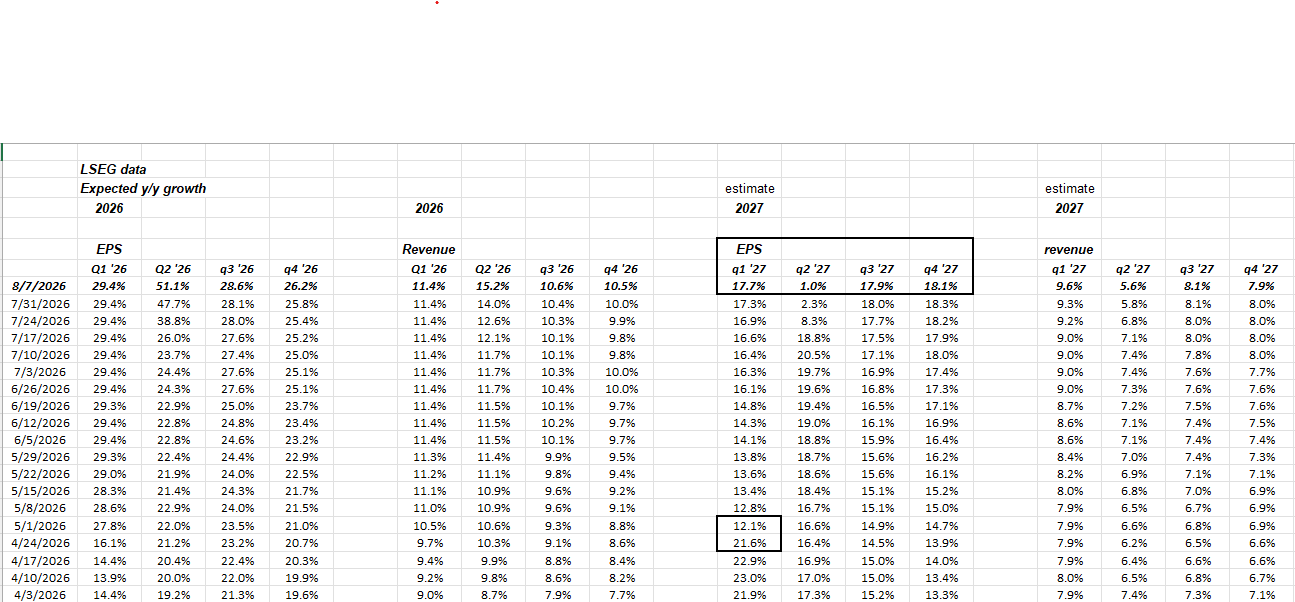
Numbers from LSEG – quarterly EPS and revenue growth expected for SP 500 updated each. Note the revisions in ’27 based on mark-ups in ’26.
This market is an absolute juggernaut in terms of EPS and revenue growth and it’s not being aided by zero interest rates and congressional stimulus like we saw with COVID.
Plus you’ve got every tech company and it’s mother adding gobs of debt, and destroying free-cash-flow, just to keep up with the AI buildout, so they are not the one person without a chair (and proven business model) when the music stops.
None of this is advice or a recommendation, but only an opinion. Past performance is no guarantee of future results. All EPS and revenue data is sourced from LSEG with attribution.
Thanks for reading.