
It’s been a few weeks since readers have been updated only because the Q2 ’26 earnings reports are mostly done, and as we roll into September ’26, we’ll start to see companies with August quarter ends, some of the most important being Micron Technology (MU), which isn’t scheduled to report until September 30th, ’26.
Oracle (ORCL) reports this week, Thursday, September 11th, after the closing bell, so that stock will be important for the technology software crowd. Kroger (KR) is scheduled for Friday morning, September 11th before the opening bell, which is a stock or company important to what is happening within grocery.
SP 500 earnings data:
- As LSEG via Tajinder Dhillon (TJDhillon@LSEG.com) reports every week, Q2 ’26 SP 500 EPS growth is currently estimated to be 53%, until the Anthropic non-operating mark-ups are removed from Alphabet and Amazon, which reduces the growth to a still-quite robust 34.9% for Q2 ’26.
- The forward four-quarter estimate jumped this past week to $381.05 to $378.31, and includes the above-referenced gains on Anthropic.
- The forward PE is still 20x down from 23x in early January ’26.
- Remarkably, the SP 500 “earnings yield) (SP EY) ended last week at 4.97%, still hovering around 5%, a yield level which drove a strong SP 500 rally in early March ’26.
- The rising 10-year Treasury yield is still below the 4.80% recent high and the 4.998% peak in late ’23, after the FOMC rate hikes. A trade above 5% for the 10-year Treasury yield will likely have a marked impact on stocks, although the robust SP 500 EPS growth is keeping the stock market relatively quiet.
- Personally, I’m still impressed with the 3.5% “upside surprise” or beat rate for SP 500 revenue for Q2 ’26. That’s the best surprise revenue upside number since COVID. The fact that Q3 ’26 will start lapping the One Big Beautiful Bill passing on July 4 ’25, means that the SP 500 could start to temper some of these revenue and EPS gains.
CPI and PPI data this week:
August PPI data will be reported Thursday morning, September 10th, ’26. While overall August PPI is expected to be around +0.4% and core PPI around +0.2%, the release typically doesn’t get much freight in terms of it’s ability to move markets, unless it’s way above the estimated consensus.
Friday morning, with all of the solemnity of the 25th anniversary of the 9/11/01 attacks, August CPI is expected to come in at +0.4%, likely driven by energy, but core CPI is expected at +0.1%, which is a little lower than the normal +0.2%.
The core CPI is the metric that really matters to the markets. What’s remarkable to me is that 5-year inflation breakeven rate has been signaling the same dis-inflationary move for the last 5 months, while the expected core CPI on a y-o-y basis due Friday morning is +2.4%, dropping from +2.5% last month.
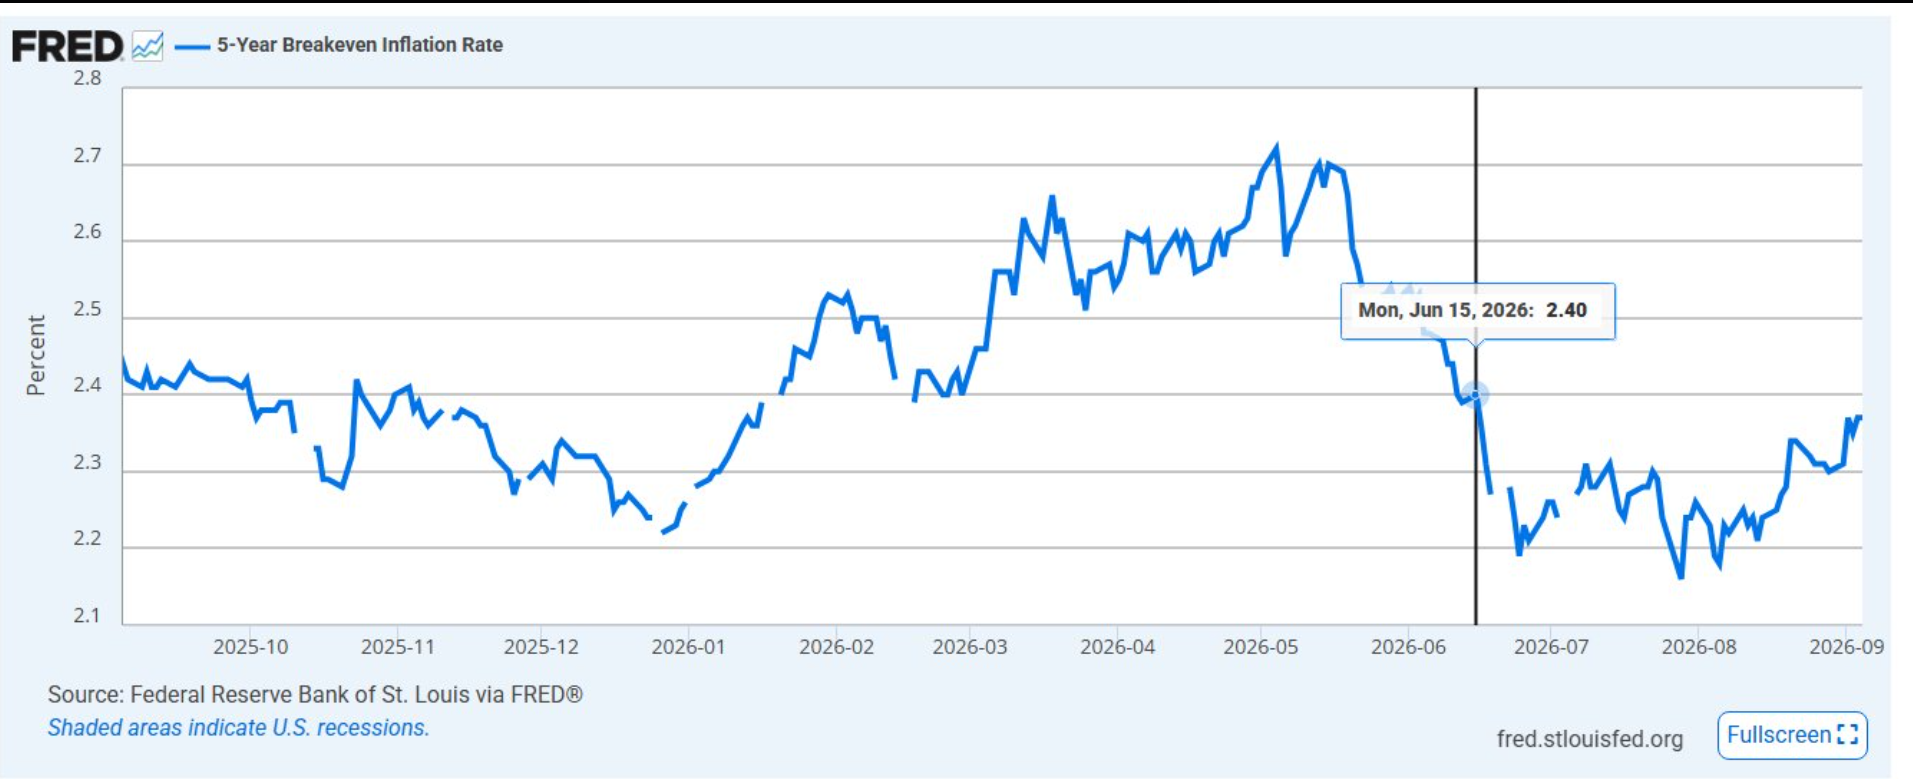
(Hat-tip to Mike Zaccardi who posted the 5-year inflation breakeven rate on Saturday, September 5th.)
The mainstream financial media seems to pay no attention to the inflation breakeven rates, and I’ve always wondered why.
SP 500 EPS growth expectations:
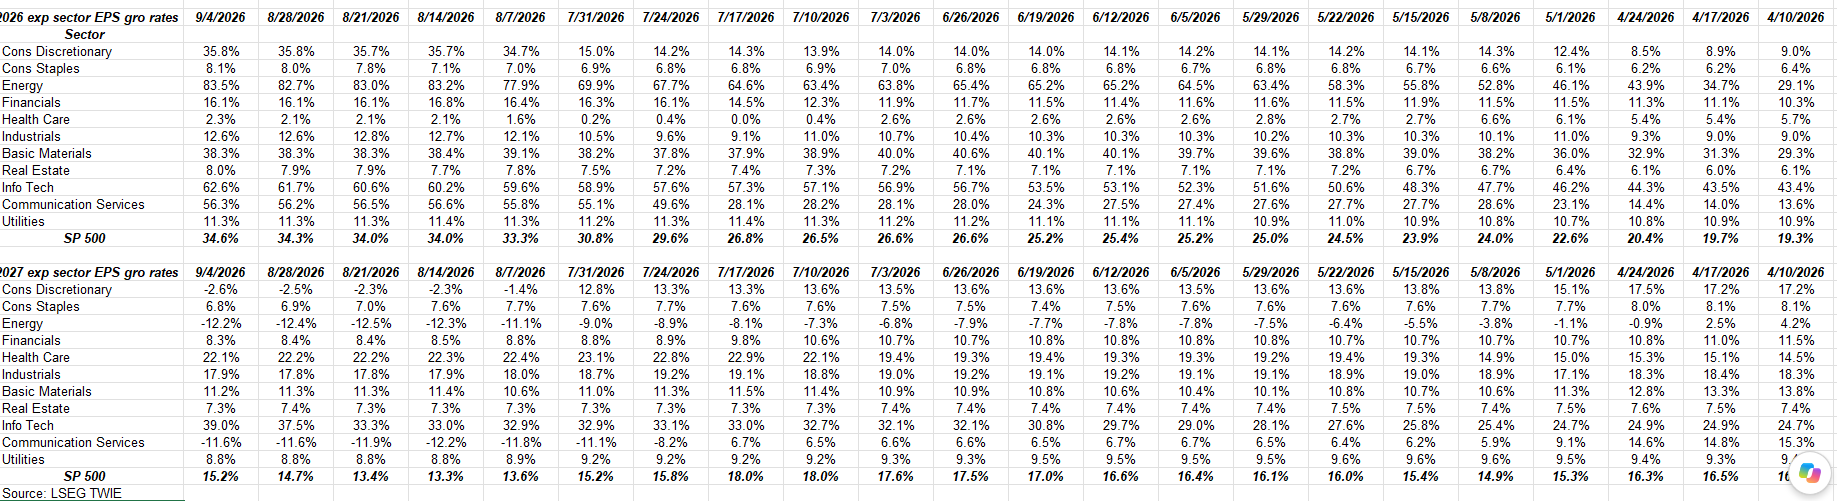
The above table is an internal spreadsheet with all the expected EPS growth sourced from LSEG.
If readers would expand the s/sheet, they’d see the only two sectors that are expected to show stronger EPS growth in 2027 than 2026, are healthcare and industrials.
Technology, consumer discretionary and communication services are expecting the steepest declines, which is where the “surprise” factor comes in.
For comparison, the s/sheet below shows what 2026 was looking for in late 2025 and early 2026, relative to 2025.
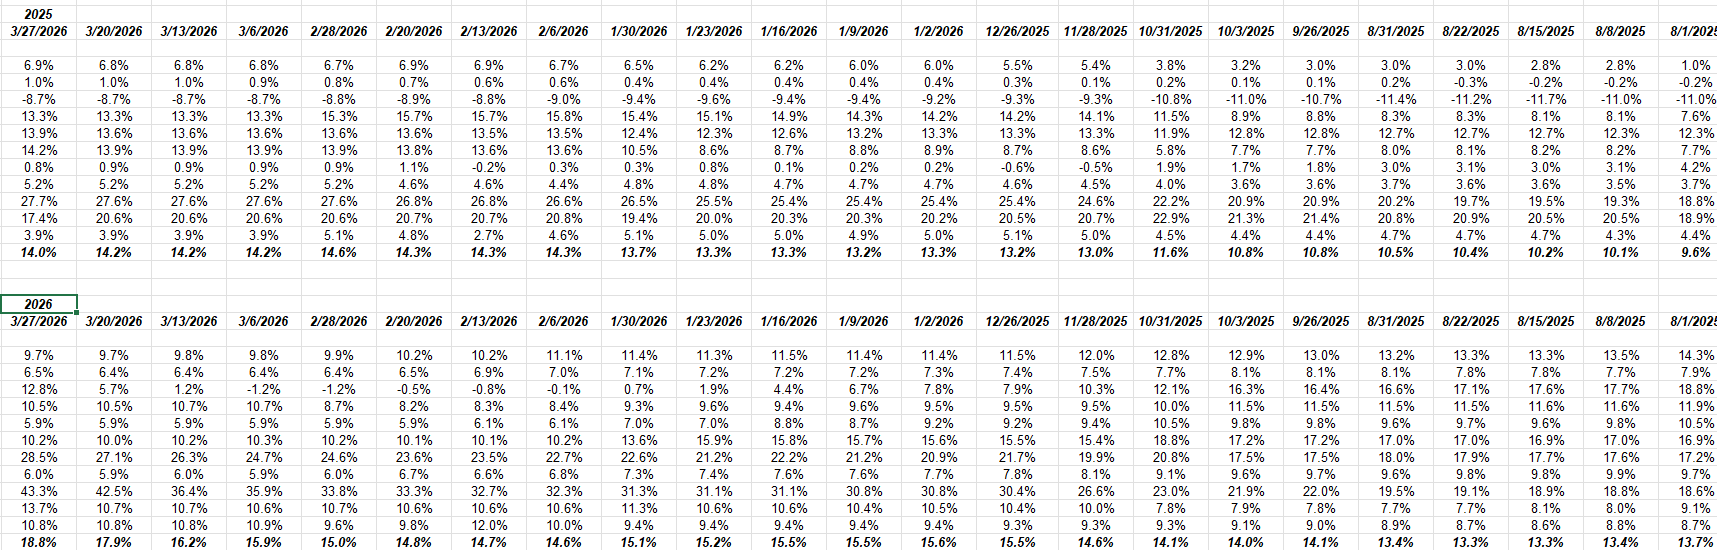
2026 EPS growth for the SP 500 was expecting a slightly better growth for 2026, as late as late March ’26, which was prior to the Q1 ’26 earnings data getting reported.
Technology was still looking for a healthy year of EPS growth in ’26, it simply turned out to be much higher, likely helped by semiconductors and hardware.
So what’s the point of the data and comparison ? Forward estimates are looking for a tougher year in 2027, at least the way the numbers fall out now.
Part of the reason simply could be tougher comparisons as a result of the exceptional EPS growth of ’26, even with the removal of Anthropic.
From an SP 500 return perspective, here’s the last 4 years of SP 500 total returns:
- 2023: +25%
- 2024: +25%
- 2025: +17%
- 2026 YTD: +13.55%
This is another reason to be cautious ahead of 2027. For those who believe in or espouse the “sequence of returns” perspective, just an average return of 7% to 10% in 2027 for the SP 500, will feel like a disappointment.
Summary / conclusion: Wait to see the core CPI data Friday morning, before drawing a conclusion about what the FOMC will do on September 15th, 16th. The FOMC release and announcement will come Wednesday, September 16th, so there is still time to get a good read on the inflation data, later this week.
An August core CPI print of +0.1% and the y-o-y rate dropping to 2.4%, would likely be well received by the markets. What surprised me about Friday’s stronger non-farm payroll number, was that the 10-year Treasury yield took it right in stride, and couldn’t close above 4.80%, let alone 5%. This blog talked about those two critical yield levels two weeks ago for the 10-year Treasury yield here.
The one missing ingredient to a major market top is the “euphoria” aspect missing from market sentiment. This blog was cautious coming into 2026, so the +13.55% on the SP 500 as of Friday, September 4th, is a pleasant surprise, as is the 60% / 40% balanced account return of 8.05%. After an 18-year secular bull market, those returns should be quite acceptable to clients.
But the lack of any real “market exhilaration” or the seeming strong desire for retail investors, to want to be long stocks at any price is completely absent.
That’s not a bad thing either, for those who remain substantially bullish.
None of this is advice or a recommendation, but only an opinion. Past performance is no guarantee of future results. All SP 500 EPS and revenue data is sourced from LSEG.com. None of the above information may be updated, and if updated, may not be done in a timely fashion. Readers should gauge their own comfort with portfolio volatility and act accordingly.