In last week’s post this blog took a look at the SP 500 expected revenue growth this year, and then looked back at the last Trump Administration tax bill passed passed in December, 2017, and found two things in common:
Tax Cuts & Jobs Act passed December ’17:
- Q4 ’17 rev growth: +8.3%
- Q1 ’28 rev growth: +8.4%
- Q2 ’18 rev growth: +9.5%
- Q3 ’18 rev growth: +8.6%
- Q4 ’18 rev growth: +5.1%
This blog only started keep revenue growth by quarter data in Q4 ’12, but the average revenue growth for all of that period – from Q4 ’12 through Q4 ’19 was just +3.2%.
OBBB passed July ’25:
Here’s the “expected” revenue growth for 2026, by quarter, per the LSEG data:
- Q4 ’26 rev gro: +8.6%
- Q3 ’26 rev gro: +9.1%
- Q2 ’26 rev gro: +10.3%
- Q1 ’26 rev gro: +9.7%
- Q4 ’25 actual rev gro: +9.2%
- Q3 ’25 actual rev gro: +8.3%
The average rev growth rate per quarter from Q1 ’22 through Q4 ’25 (removing Covid’s distortions in 2020 and 2021) was +6.5%.
For 2025 and 2026, the difficulty for investors is separating how much is AI and “tech” and how much is tax-bill related. The difference is obvious in 2018, but not so much today.
The last 5 quarter’s technology revenue growth per quarter:
- Q1 ’26: +27% (estimated)
- Q4 ’26: +21.5%
- Q3 ’26: +16.8%
- Q2 ’26: +16.3%
- Q1 ’26: +13.3%
It’s easy to over-simplify, but layering the OBBB onto the rest of the US economy on top of the continued white-hot AI buildout in terms of revenue growth, and capex, maybe one reason why this market seems so strong today.
Just sayin…
SP 500 data:
- The forward 4-quarter SP 500 EPS estimate increased again this week to $342.49, versus last week’s $340.96.
- The PE on the forward estimate is 20.9x this week, versus 20.9x last week.
- The SP 500 earnings yield (SP EY) ended the week at the same level as the prior week at 4.78%.
- High yield credit spreads have gradually tightened since early April ’26, from +342 to +284 (per Bespoke data).
- Since January 2nd ’26, the expected SP 500 EPS growth has risen from 16% on 1/2/26 to 20% today (4/24/26).
- The average “upside surprise” or beat rate for SP 500 Q1 ’26 EPS reports is still 9.2%, while the average revenue upside surprise is 2.1%.
Here’s the weekly progression in SP 500 weekly dollar estimates since January 2 ’26:
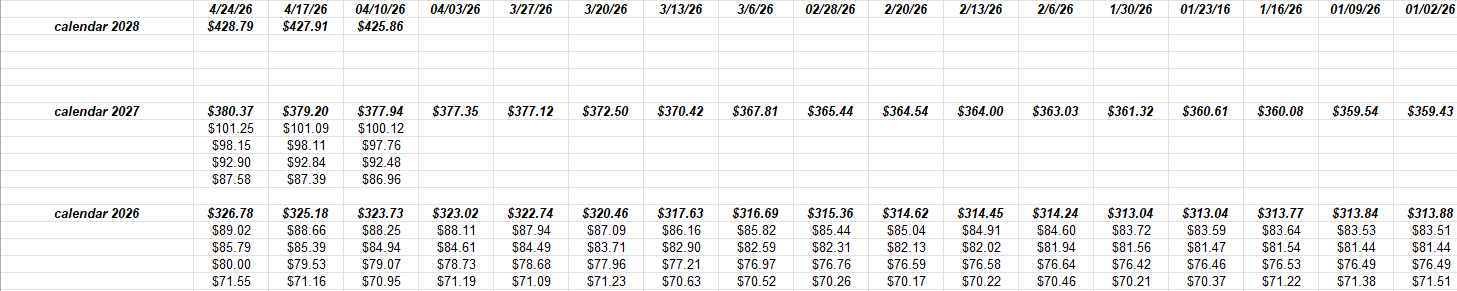
(click on spreadsheet to enlarge)
Quick summary: Within tech, hardware like semi’s and Dell have been red-hot, while software corrected again after IBM (IBM) and ServiceNow (NOW), so Wednesday night’s earnings lineup of Microsoft (MSFT), Meta (META), Alphabet (GOOGL), and Amazon (AMZN), will be scrutinized closely.
It’s hard to think that if Microsoft is seriously dented by AI, that the 2nd tier software names can grow this part of the software biz substantially.
We’ll have to wait and see.
It’s another good earnings season again. Energy’s expected 43.9% EPS growth rate for ’26 has now caught up to tech’s 44.3%.
Bet no one expected that to start 2026, and maybe more importantly, that the rest of the market would brush off the energy sector growth entirely, including bonds.
None of this is advice or a recommendation but only an opinion. Past performance is no guarantee of future results. None of this information may be updated, and if updated may not be done so in a timely fashion. All EPS and revenue information is sourced from LSEG.
Thanks for reading.