(h/t Mike Zaccardi on X)
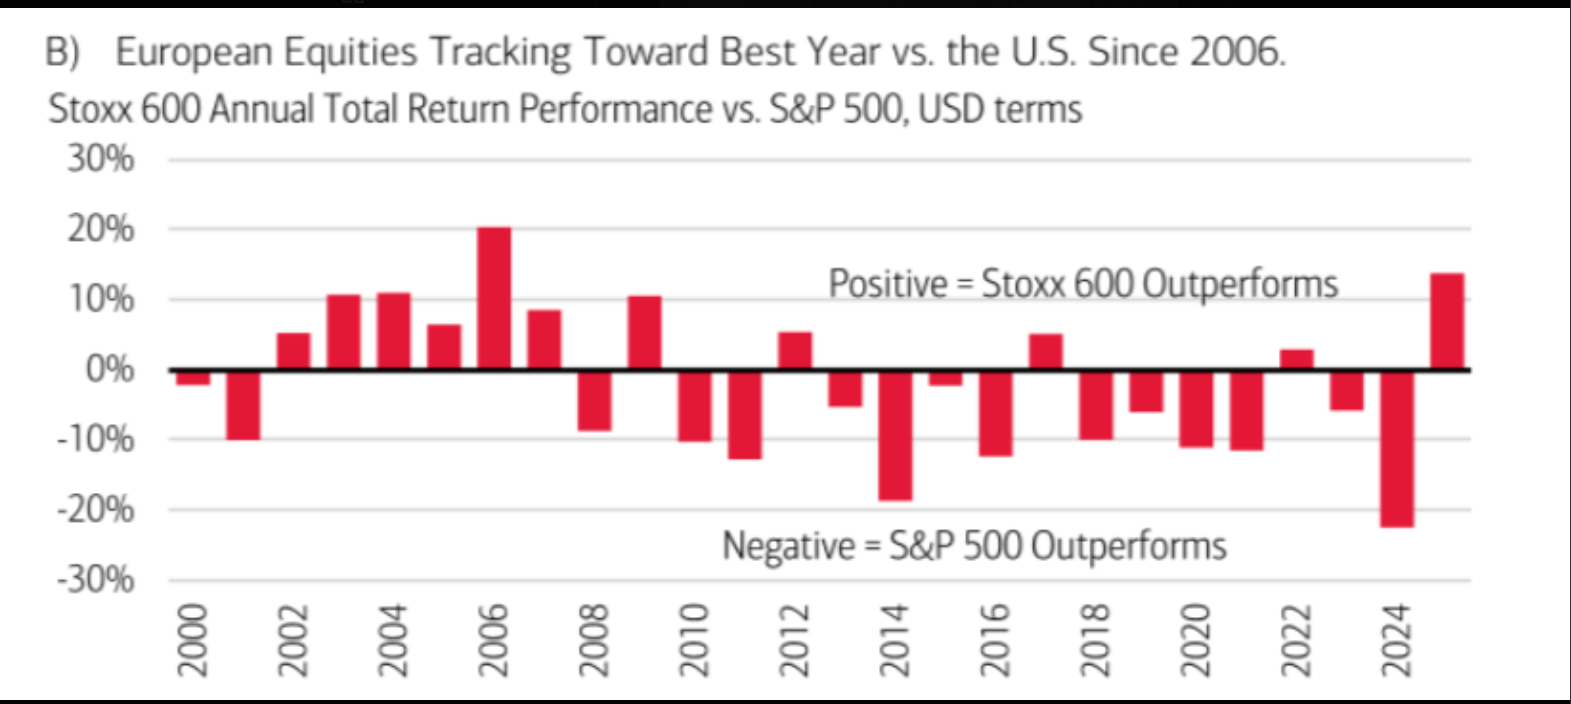
Per this bar chart, European equity is having it’s best year vs US since 2006. European equities are being driven by the big banks, and the anti-immigration policies of Italy and Germany, not to mention the US mandating that NATO commit 5% – 6% of GDP to NATO defense, after previously relying on the generosity of America to foot what is thought to be about 70% of the NATO defense bill. (Source Google and Grok).
International Annual Returns:
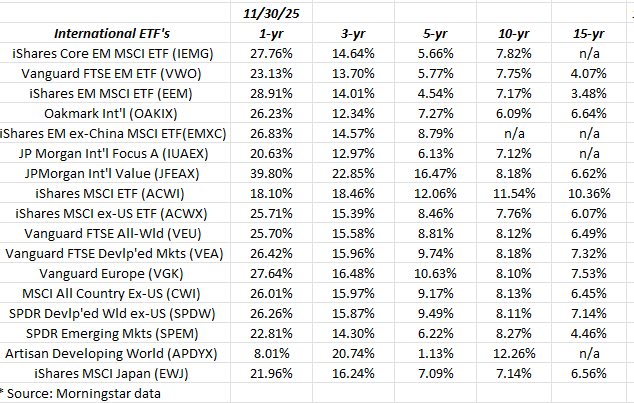
Source: internal spreadsheet – Morningstar annual returns
The most compelling aspect to the international return data is that the 5,10 and 15-year returns are still mostly single-digit.
The underperformance of international since just prior to the 2008 Great Financial Crisis has been material.
Japan:
In 2025, this blog started buying the iShares MSCI Japan ETF (EWJ) for some clients. There are worries over the “yen carry trade” bubbling up again, but even with the Japan 10-year note trading up to 1.97% today, the Japanese stock market seems to have taken the end of the so-called trade in stride.
It was last August ’24 where the trade bubbled up one weekend, got everyone’s attention in the Sunday night futures markets, the US markets opened sharply lower that Monday morning, only to have the worries dissipate within a day or two.
It’s a personal opinion, but after 36 years of a deflationary economy with the Nikkei not making a new high during that time, the fact that the Nikkei has now broken out, and the Japanese stock market is absorbing higher interest rates, might be signaling to investors that the old worries are over.
Again, that is one opinion.
Japan’s new Prime Minister and the fact that she is very cautious on China, might move Japan closer to the US on trade policy. My understanding of the whole 1980’s Japan economic miracle was that the huge trade surpluses generated by Japan (but Japan closed off their domestic markets to any serious competition) forced all that yen into a gigantic real estate bubble, that led to 35 years of a domestic deflationary economy and zero interest rates. While that summary is probably greatly simplified, hopefully readers get the point.
Summary / conclusion: In addition to the above mutual funds and ETF’s being tracked, this blog should start a single-country ETF spreadsheet with annual returns, but I should also eat less sugar and exercise more, so we know how that will go.
The point is (some) international has seen a lamp lit underneath it. Looking at longer-term annual returns, the 5,10 and 15-year international returns are still attractive relative to the SP 500 and large-cap US indices.
Japan is very interesting after a 35-bear market in the Nikkei.
Just like the late 1990’s, we have to assume that the tech trade and the Mag 7 and the Nasdaq Comp and QQQ trade will end at some point, and perhaps not quietly.
None of this is advice or a recommendation, but only an opinion. Past performance is no guarantee of future results. All return data is sourced from Morningstar. Readers should gauge their own comfort with portfolio volatility and adjust accordingly. It’s likely in 2026 these “annual return” posts will be done less frequently, like every 2 or 3 months, rather than monthly. None of this information may be updated, and if updated may not be done on a timely basis.
Thanks for reading.