There is still little change in the trend in forward SP 500 estimate revisions the last few weeks. This blog has not posted on SP 500 earnings the last few weeks, just to give the topic a rest, given the sudden new focus on SP 500 earnings by market watchers.
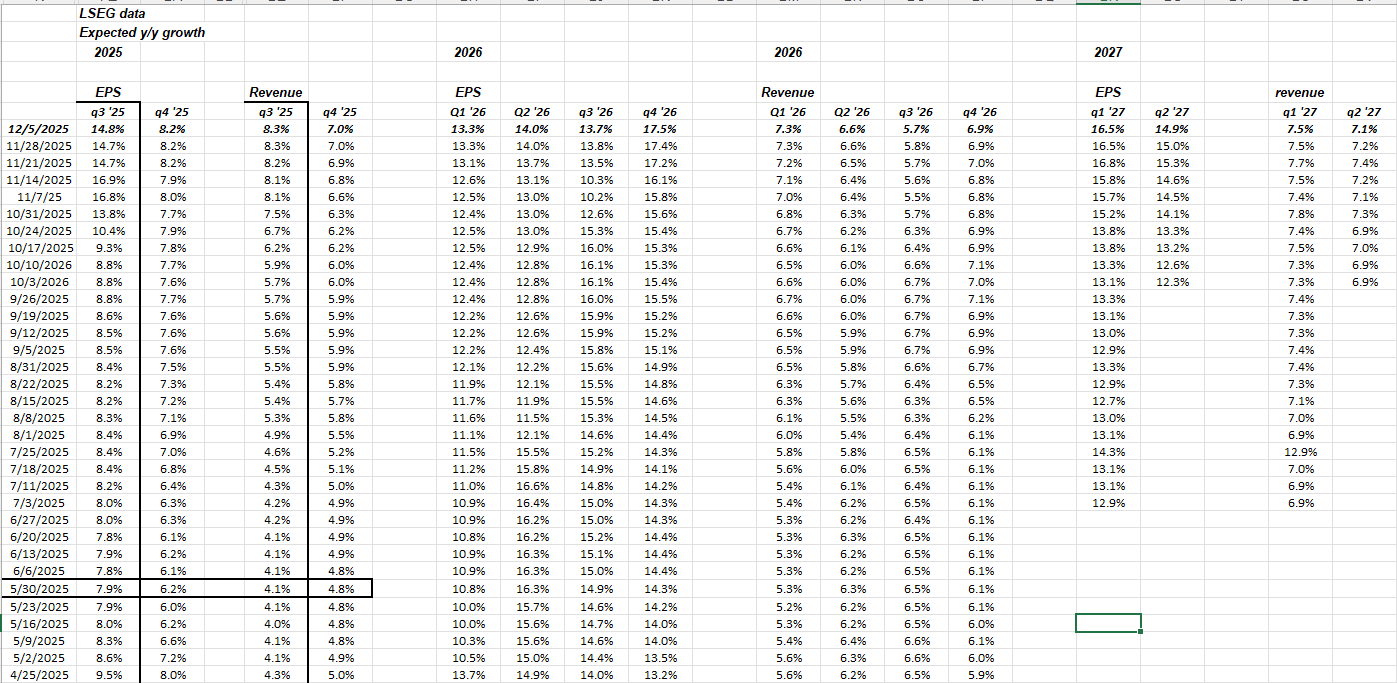
This graph shows the trend in expected growth rates for forward quarters.
The horizontal black-bordered area shows the bottom for Q3 and Q4 ’25 EPS and revenue growth rates, post “Liberation Day”.
The bottom for growth rate revisions looks like it happened between the last week of May ’25 and the first week of June ’25.
SP 500 earnings are still expected to grow 14% in 2026, which is just 3 weeks away. Q4 ’25 earnings won’t start until January 10th, ’26, but once Q4 ’25 earnings hit, investors get the best view of ’26 guidance from management’s and then we’ll see what the expected 14% growth rate for 2026 SP 500 earnings looks like, and how it changes.
SP 500 data:
- The forward four-quarter estimate (FFQE) for the SP 500 has been the exact same for three weeks in a row, coming in (again) this week at $296.15;
- The forward PE on the SP 500 at Friday, 12/5/25’s close is 23.2, versus the start of the year’s 21.8x;
- The SP 500 earnings yield is now 4.31% versus 4.6% at the start of 2025;
- High yield credit spreads tightened roughly 20 bp’s this week (per Bespoke data), while investment-grade credit spreads remain in the low 80’s, and were unchanged on the week;
- The SP 500 EPS “upside surprise” ended the week at 9.5%, which is the highest level of upside surprise since 2021 or Covid’s zero interest rate policy;
- The SP 500 revenue “upside surprise” remains at +2.2%, which is healthy, and a little above average, but below 2021’s Covid era levels of 5%’ish;
To give readers a look at how the calendar year SP 500 EPS have changed since mid-July ’25:
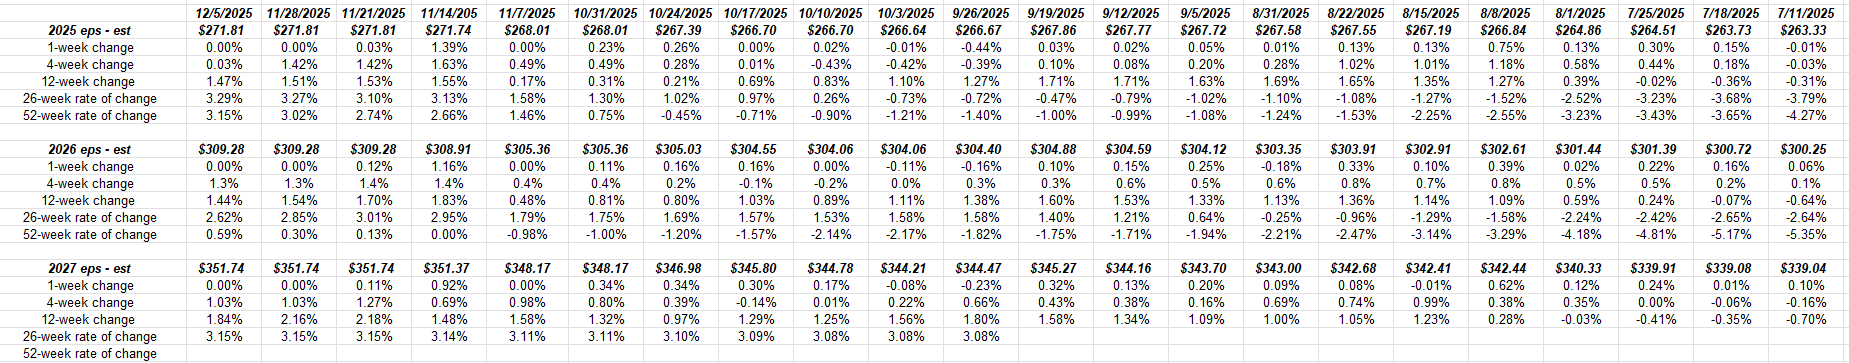
Those rates-of-change are very healthy.
Summary / conclusion: Oracle (ORCL) reports their fiscal Q2 ’26 financial results Thursday, December 11th, after the market close. Oracle’s stock is down about 30% since it’s September ’25 highs around $325, part of that due to Oracle’s debt issuance in November of $56 billion. Oracle’s credit default swaps (CDS) are getting a lot of attention as they have increased in value for the software giant, meaning the probability of Oracle’s debt defaulting have increased. That being said, these are every-day trading markets and prices will change frequently as will perceptions of the various securities.
Costco’s (COST) quarterly earnings results also come out Thursday, December 11th after the closing bell. The stock is trading about $175 lower from it’s all-time-high of $1,078 in February ’25, and is now trading below both it’s 50 and 200-day moving averages. On the weekly chart, Costco is now trading at it’s most oversold level since 2022. Sam’s, Walmart’s warehouse club segment, is just 13% of Walmart’s total revenue and 10% of Walmart’s total operating profit, has seen a resurgence in operating results the last few years, under CEO’s Kath McLay, now the Walmart International CEO and the current CEO, Chris Nicholas. The point being perhaps Sam’s improvement is putting a little pressure on Costco. From the timing of the all-time-high on Costco’s stock, and the recent announcement of Costco suing the Trump Administration to recover tariff costs, perhaps Costco may be having a more difficult time adopting to the new tariff environment than Walmart has demonstrated. We’ll see if the conference call comments on Thursday give shareholders clues as to why the stock has weakened this year.
It’s really tough to be bullish on the SP 500 with the estimate revisions being as strong as they are. The only period close to this in terms of positive revisions, earnings surprises, etc. was late 2020 and early 2021.
This blog is more bearish on 2026 as was detailed here, and another post is forthcoming with additional reasons to be a little worried about 2026.
None of this is meant as advice or a recommendation, but only an opinion. Past performance is no guarantee of future results. LSEG is the source of the SP 500 earnings data shown on most blog posts unless Factset is used (and is identified) although the calculations made from those estimates are this blog’s responsibility. Readers should gauge their own comfort with portfolio volatility and adjust accordingly.
Thanks for reading.