The SP 500 could return 5% – 7% in 2026, and while it would feel like a significant change, the SP 500 would have just an average year in terms of historical annual returns.
The “average, annual” return for the SP 500 since December 31, 1999, is 8.10% as of 11/30/2025.
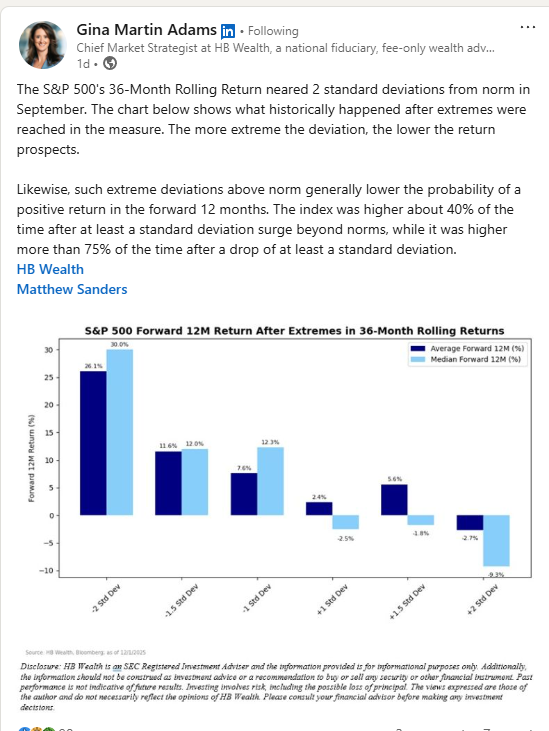
Gina Martin Adams shows above how the 36-month rolling return has reached 2 standard deviations, which according to the bar chart above, shows that “expected, forward returns” for the SP 500 tend to shrink rapidly.
I remember in March, 2000, there was a technical analyst by the name of John Roche who noted that the semiconductor index (SMH) was 3 standard deviations above it’s 200 day moving average, a level that had never been seen before. The name of the firm John worked for couldn’t be recalled, but that was the top of the 1982 – 2000 secular bull market. Whether he was trying to or not, John called the market top almost precisely.
What was quite painful for those of us whole lived through it was the ensuing 10 years. I do remember getting an AOL instant message from Norm Conley, CEO & CIO of JAG Capital Management, located in St. Louis, stating that as of January, 2009, the rolling 120-month return (essentially 10-year return) for the SP 500, had just reached a level not seen since the Great Depression.
Readers can see the two extremes: a record return decade for the 1990’s, and then a record bear market immediately following from 2000 to 2009.

Click on the box above, and note the PE expansion / contraction periods. This pattern is somewhat consistent with “return streaks” which this blog addressed in an article this past week. Some call this “sequencing of returns” or return clustering.
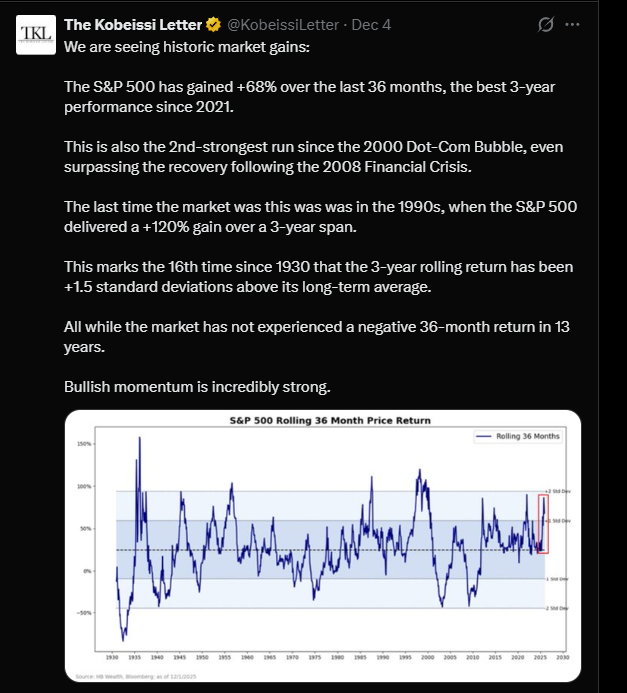
Finally, the Kobeissi Letter picks up on the 3-years of SP 500 returns, similar to this blog’s post linked above, but also incorporates Gina Martin Adams analysis in terms of reaching extremes. Kobeissi posts tend to be more bearish, which is why I read him, but the letters are solid analysis.
Summary / conclusion: We could see a low single-digit-return for the SP 500 (and given the concentration, the Nasdaq as well), in the next few years, although the AI bulls remain steadfastly with their foot on the gas.
We are in the 16th – 17th year of a secular bull market, which means the bull is growing very long in the tooth.
This blog will do more re-balancing into non-correlated assets again in January ’26, there is risk too that the bull market continues for a few more years.
These blog posts are written more so that I can flush out the thought process and go through the analysis, and put it to paper, rather than just thinking about it.
Feel free to voice your opinions: remember, opinions (and fundamentals) make markets.
None of this is advice or a recommendation, but only an opinion. Past performance is no guarantee of future results. None of the above information may be updated, and if updated, may not be done in a timely fashion.
Thanks for reading.
I too remember the 2000 – 2010 period well. Doesnt feel that long ago to me. Among many things, fretting about where p/e multiples would settle? How low could things go? The slightest negative news spooked everyone. Years of uncertainty with optimism struggling to gain traction.
There are a LOT of folks out there today that have read about this decade, but they’re too young to have “felt” what the roller coaster ride was like. There is a huge difference between reading and experiencing. I worry how this cohort is going to react when the tide innevitably turns. Add to this, the massive difference with automated trading and AI systems of today, compared with the more basic tools of the 2000-2010 era.
I enjoy your postings. Thanks
thank you.