Rather than bury the lede, the title tells readers the surprise received this weekend, after updating SP 500 EPS estimate this week. My guess is LSEG had a problem with some of their data in the last few weeks since the forward-estimate and the quarterly bottom-up estimates remained unchanged for 3 weeks, but imagine the surprise looking at 2025 EPS data this weekend. 2026 is expected to see +14% SP 500 EPS growth. 2025 was on track for 9% growth as recent as 5 months ago.
Even with Broadcom and Oracle’s earnings reports last week (noting the stock reaction), the expected “technology sector” growth rates were still revised slightly higher with this weekend’s “This Week in Earnings” report.
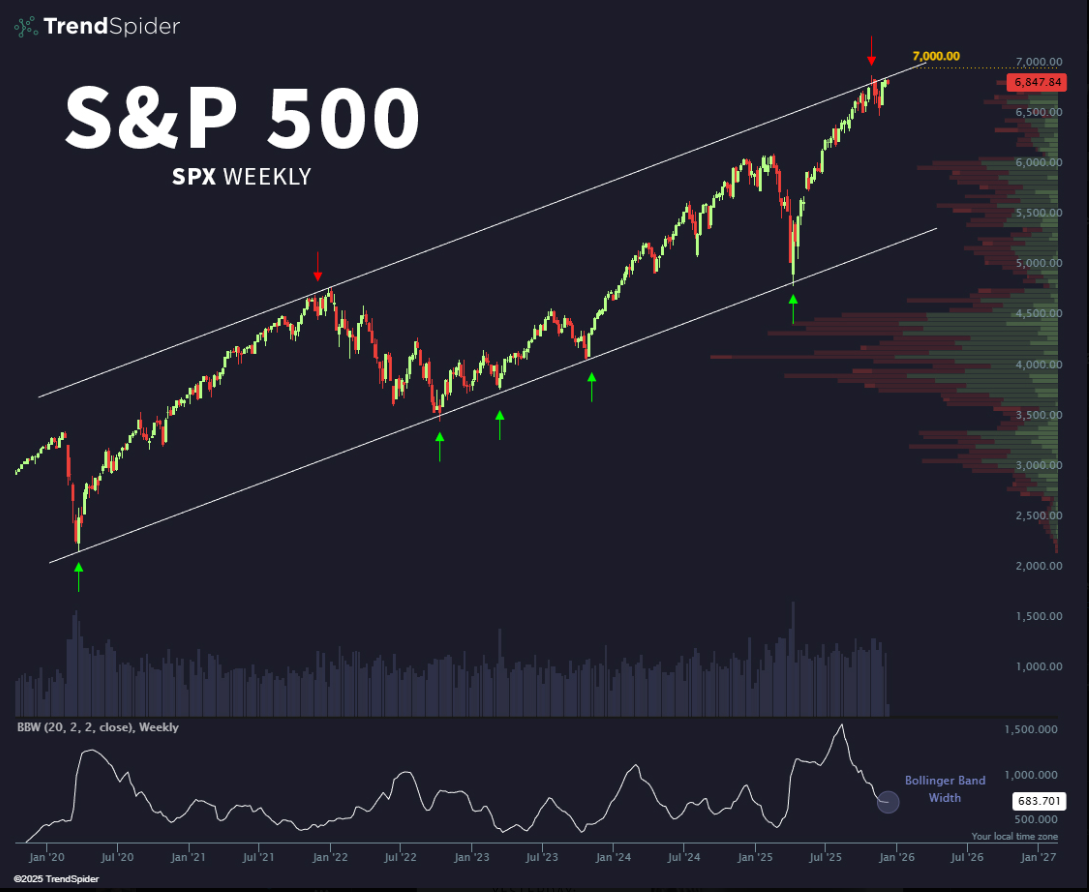
Scary chart #1: Trendspider’s SP 500 weekly chart with Bollinger Bands. The SP 500 could have a sizable correction and not violate the Bollinger band downside trend line.
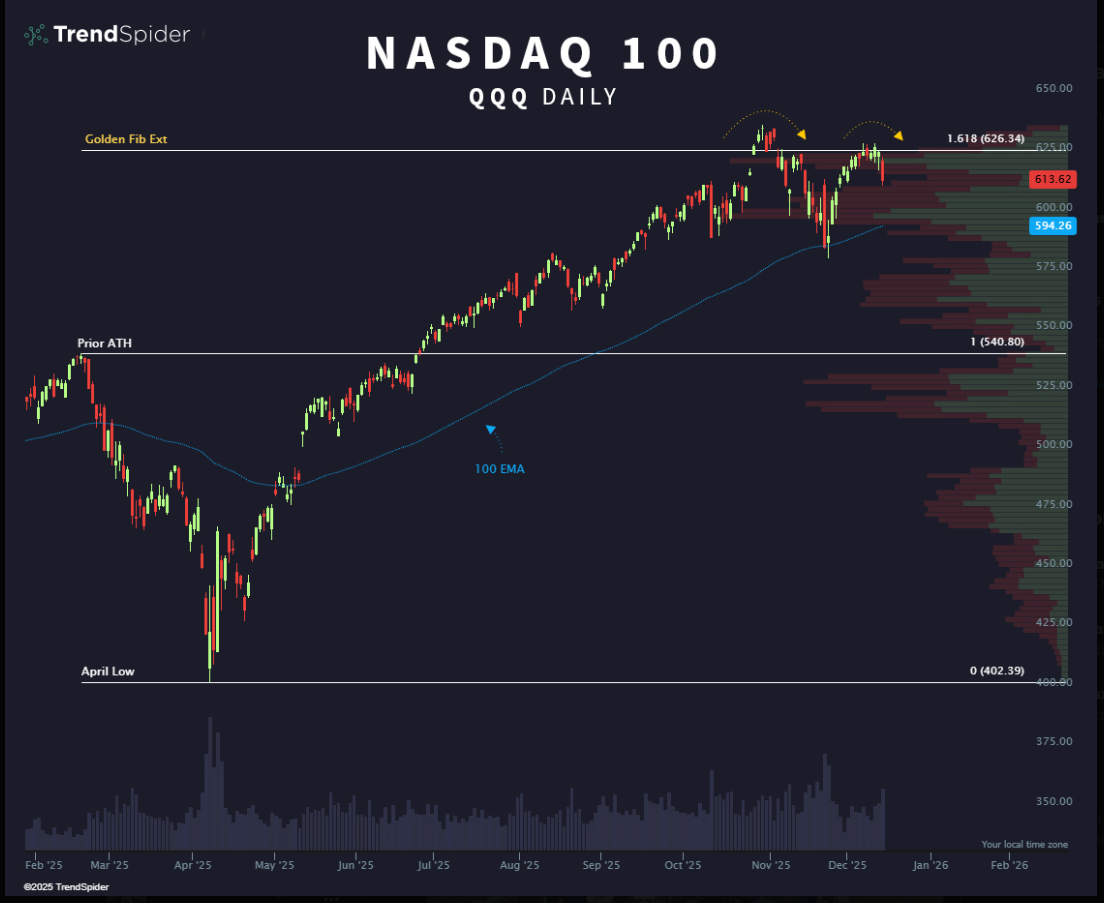
Scary chart #2: The Nasdaq 100 (QQQ) daily chart. The QQQ’s backing further away from the 10/29/25 637 all-time-high.
Now the flip-side of the scary technicals featuring very bullish earnings fundamentals:

Look at the first data column, i.e. the trend in Q3 ’25 SP EPS growth rates. That’s almost a doubling off the 6/8/25 low point of an expected +7.8%. We might get above it by next week’s update.
- The forward 4-quarter estimate (FFQE) for the SP 500 EPS figure edged above $300 this week to $303.64 from last week’s $296.15. (LSEG had a problem with the bottom-up quarterly data, and didn’t update for three weeks, so that’s why there was such a big dollar increase: $7 is a very big jump for week-to-week data. That size increase usually happens when the data rolls from one quarter to the next.)
- The calendar 2026 estimate is now $316, while that estimate was just $300 on July 18th, ’25. That’s another indication of the size of the EPS revisions being seen this year.
- The 2025 SP 500 EPS estimated growth rate has now risen from 9% on July 25th to +14% as of December 12 ’25. (That is a sizable bump in just 5 months.)
- The SP 500 earnings yield ended the week at 4.45%, still too low in my opinion.
- High-yield credit and investment-grade credit spreads ended the week basically unchanged.
Summary / conclusion: This week’s missive was a little different in that it’s about more than SP 500 earnings fundamentals. The charts are a bit worrisome, and need to be heeded, but let’s see what the last two trading weeks of the year hold for investors.
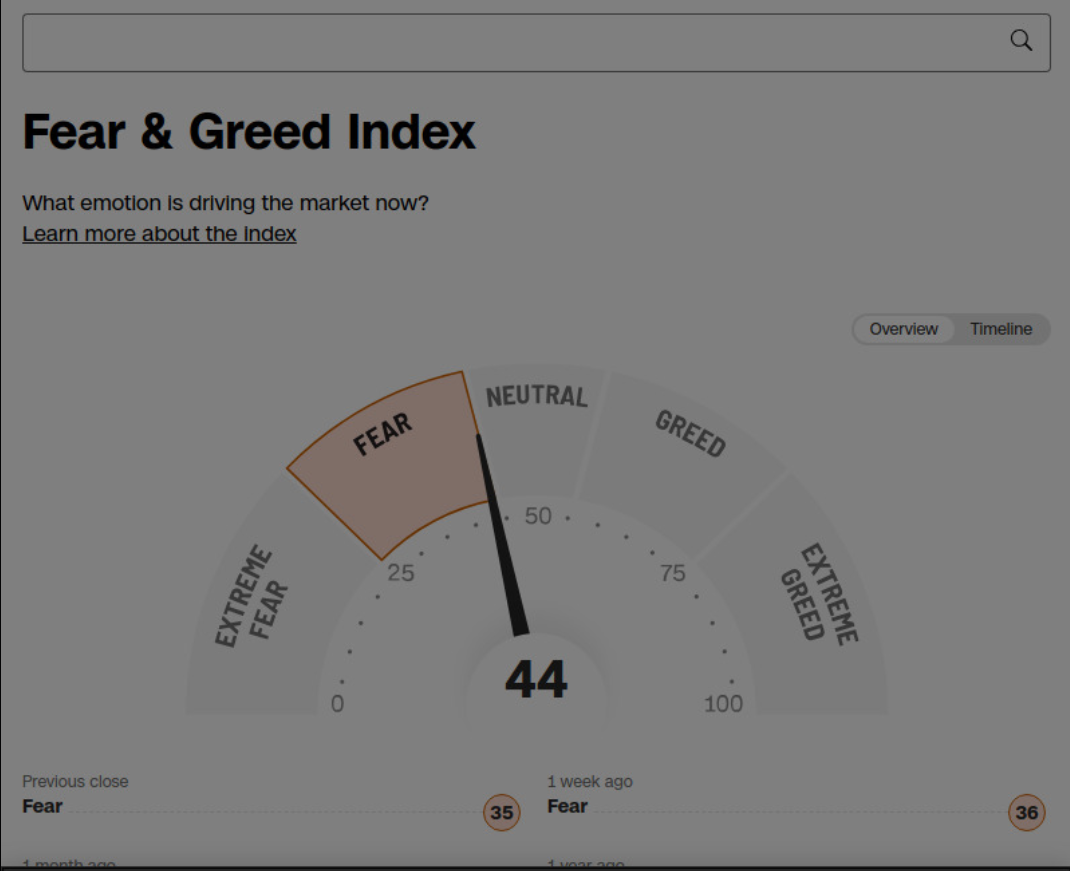
The one aspect to this secular bull market in US equities that is somewhat strange, is the rather negative sentiment that’s regularly seen.
That’s a positive aspect for those bullish on the tape. How many bear markets have started while being ensconced within the “fear / extreme fear” sentiment blanket?
SP 500 earnings estimates have never been a great market timing tool. As readers can probably guess, the markets will always move first and the earnings estimates – and more importantly revisions – will eventually follow. Analysts are human too.
None of this is advice or a recommendation, but only an opinion. Past performance is no guarantee of future results. All SP 500 EPS and revenue data is sourced from LSEG.com.
Thanks for reading.
Good morning! I am seeking an answer to the following… has there ever been a time where profit margins were growing and earnings are growing and there was a substantial contraction in P/E multiplies?
thank you.
Probably from mid-2007 through 2008. That’s a guess. I might have the data somewhere. That was pre-the 2008 Great Financial Crisis.