The first Great Conundrum was in the early 2000’s after the 2001 – 2002 50% bear market in the SP 500 and the start of Gulf War II in March, 2003. Alan Greenspan started hiking the fed funds rate (if memory serves correctly in 2004 – 2005 (?) but the Treasury yield curve started flattening out.
Rick Santelli, the great CNBC reporter would do live shots from the 30-year Treasury pit at the then-CBOT (Chicago Board of Trade), which is now part of the Chicago Mercantile Exchange (CME) and Rick kept citing the “+90% levels of bearishness” on the part of Treasury futures traders, and yet the long-end of the Treasury curve kept rallying in spite of all this.
I don’t know if Greenspan called it the “great conundrum” or just “the conundrum” but what it was foreshadowing (ultimately) was 2007 and 2008, and the worst recession since the 1930’s.
To put that period into context, the 2001 – 2002 bear market for the SP 500 was only the 2nd 50% correction in the post WW II period, and the first 50% correction since 1973 – 1974. Coming out of that in the early to mid-2000’s, the Street expected a roaring economy under a Republican President (Bush 43) particularly given the fiscal stimulus from the Gulf War, and rising inflation, (hence the bond bearishness), and it just never happened.
The 10-year Treasury yield rose from 3.5% in 2003 to 5% in 2007, but the move in early 1987 was much, much faster, and much more damaging.
The (2nd) conundrum:
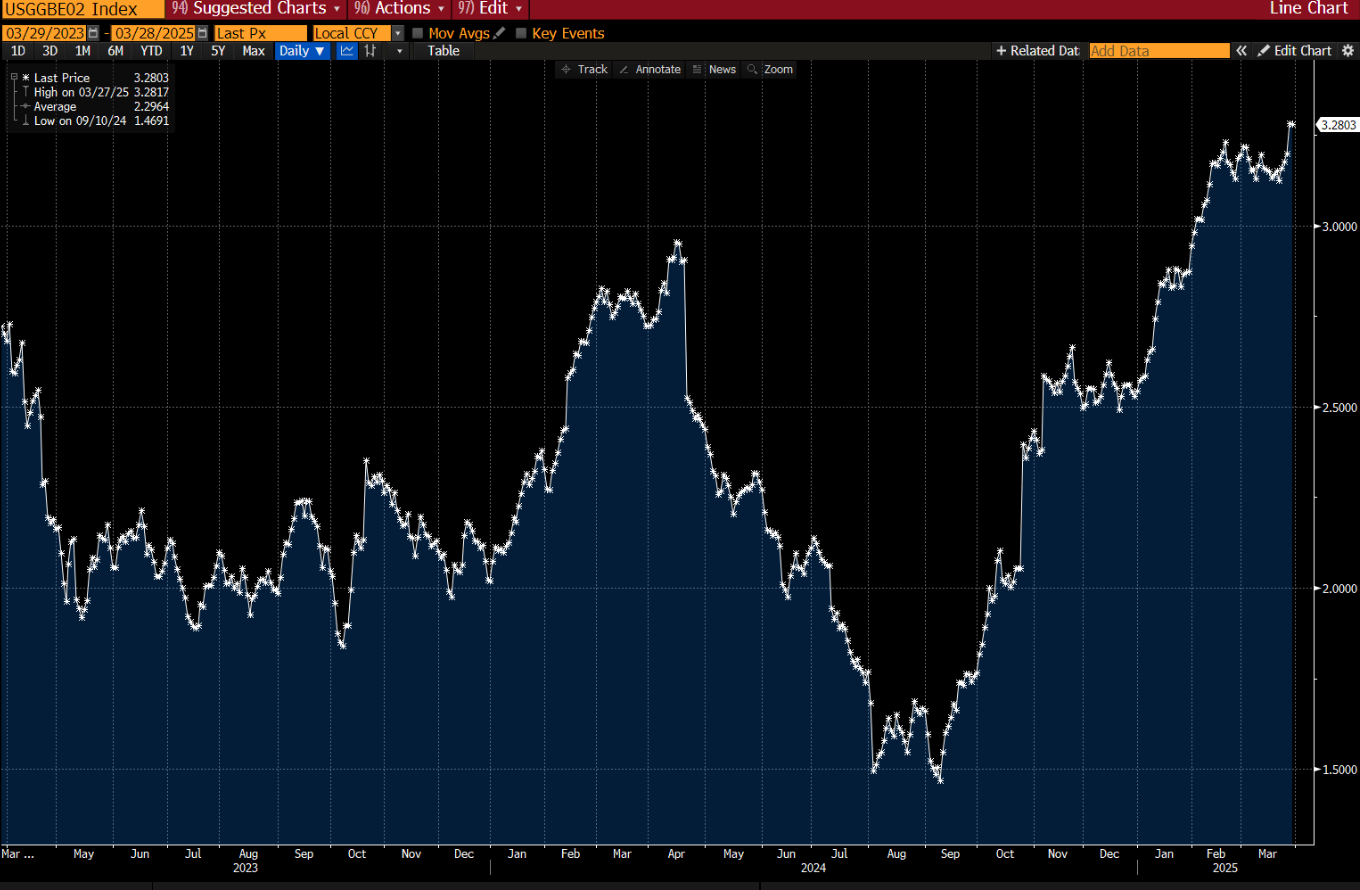
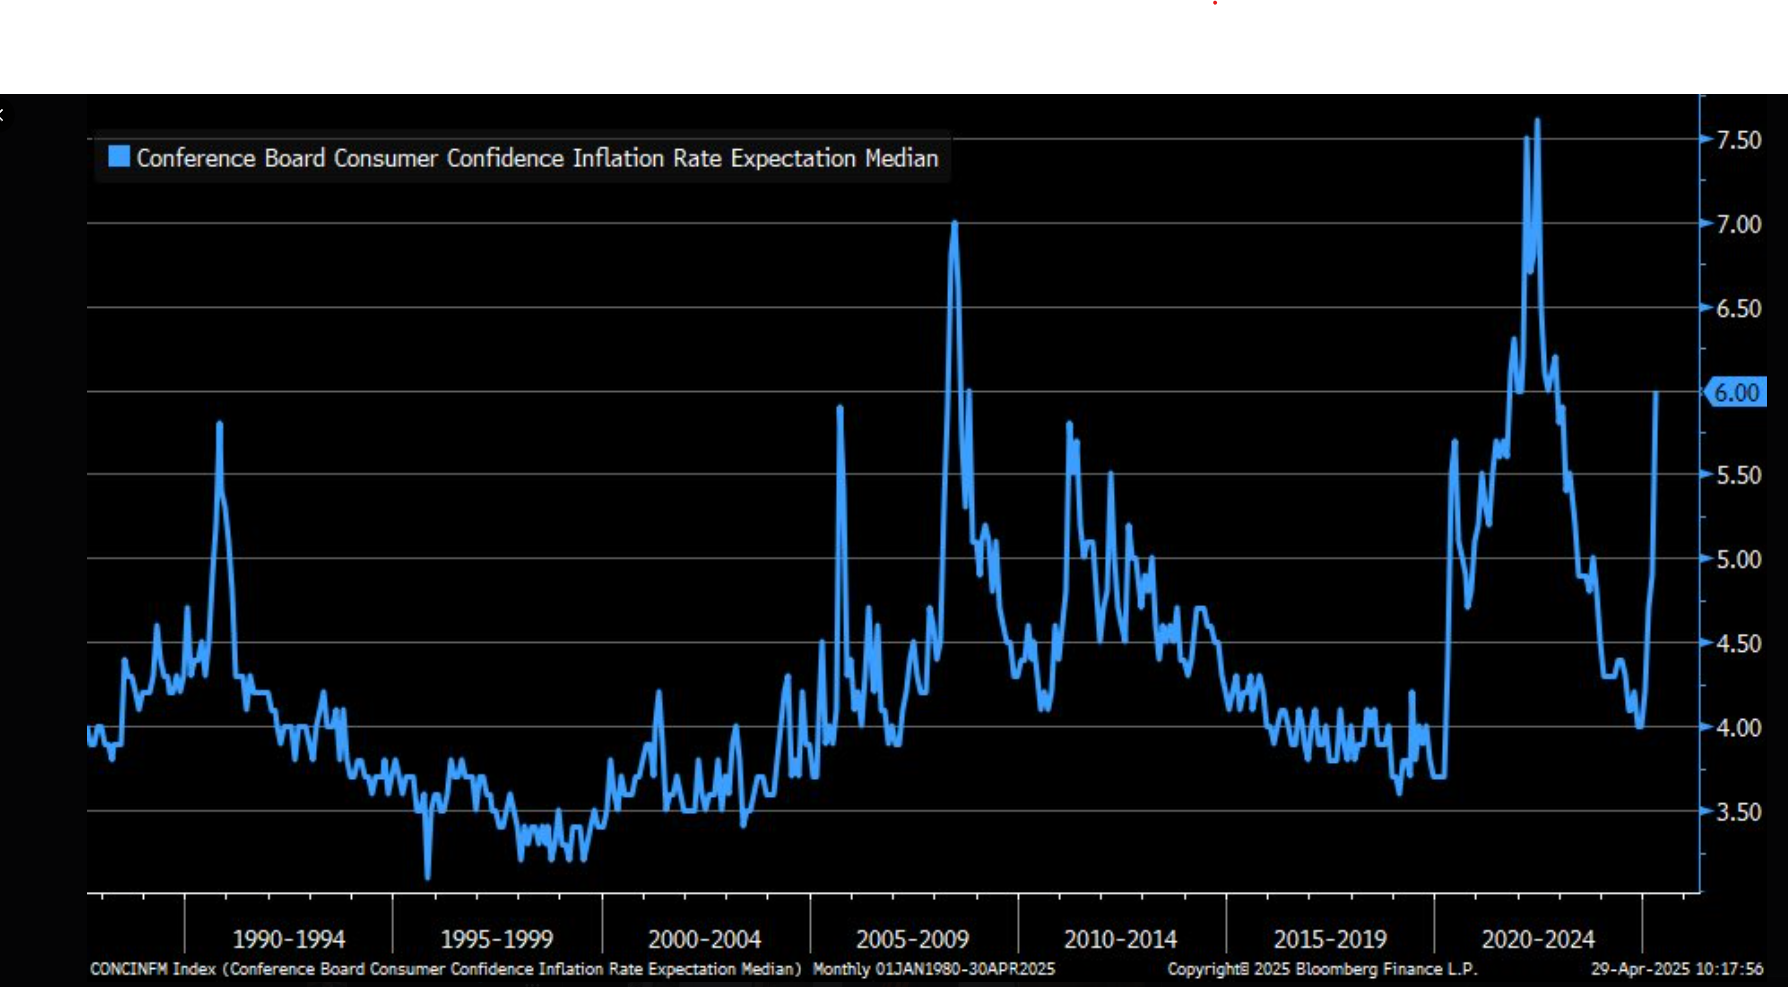
The first chart above is from Lisa Abramowicz, who is a Bloomberg reporter and does a good job at it, and the graph is from late March ’25, and shows the rising inflation expectations “pre-Liberation Day” with the 2nd chart being from LizAnn Sonders of Schwab, from an April 29th post on X, also showing rising inflation expectations.
Every economic and money and banking text educated me on how “inflation expectations” were always more critical to bond-market participants than actual inflation, which makes sense since “expectations” are forward-looking, but there is a definite disconnect today since the 10-year Treasury yield is down from 4.80% in January ’25, to 4.30% today.
Do you believe “price” or the economic data ?
What’s the disconnect telling us today ? (Maybe nothing. Maybe it’s just how inflation expectations are measured.)
Summary / conclusion: For a little fun and to use the historical comparison, the disconnect between inflation expectations and the 10-year Treasury yield isn’t being labeled a new conundrum yet, but it’s puzzling for sure.
In today’s FOMC statement, I truly wonder if Jay Powell will allude to the fact that if the President hadn’t set off the “tariff kerfuffle” as it’s been described, Jay Powell and the FOMC may have had adequate reason to start lowering the fed funds already, given the very good inflation data from the core CPI and the Core CPE from January to March ’25, AND the falling price of crude oil.
The Fed Chair is now forced to wait and see how the tariff policy changes impact pricing and thus inflation through the 2nd quarter and even into the 3rd quarter.
None of this is advice or a recommendation but only an opinion. Past performance is no guarantee of future results. None of this information may be updated and if updated may not be done in a timely fashion.
Thanks for reading.
Take a look at GSCI and Bloomberg Commodity Indices since end of February. They are trending down roughly 4%.
thx. econ data weaker, inflation news very good. Maybe Pres has it right in pounding Powell, even though i cringe everytime i read the Fed-related tweets.