
The October CPI was hot this past week, hotter-than-expected for the October ’26 overall CPI and the October ’26 Core CPI.
Prior to the October CPI release, the probability of the new fed funds range for the December 9th meeting of 4% to 4.25% was 80%, but after Friday, November 13th ’26 the new probability has increased to 88.5%.
There is just an 11.5% probability of a 50 bp rate hike on December 9th, ’26.
How the Treasury yield curve changed this week:
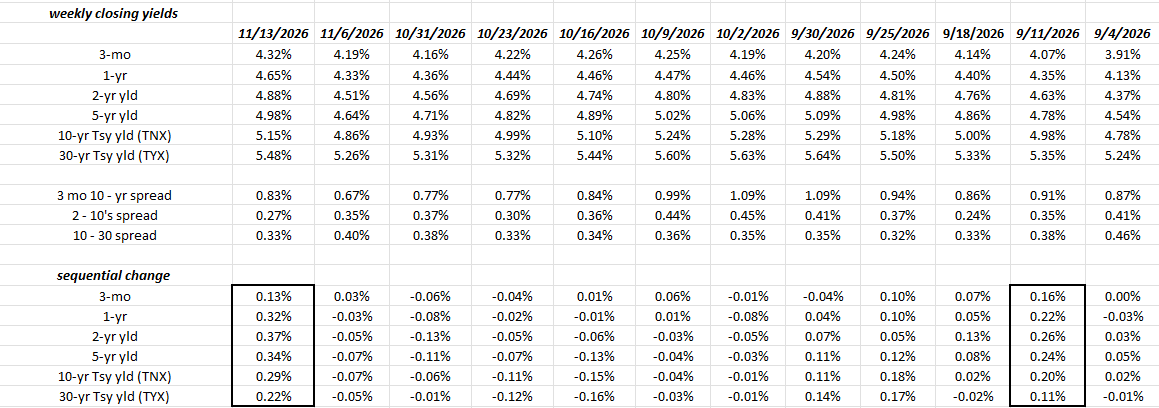
The two black-boxed areas on the spreadsheet show the sequential yield change for the various Treasury maturities listed. Prior to the week of September 18th FOMC meeting, the Treasury yield curve didn’t react until the week prior to the FOMC meeting that boosted the fed funds range to a mid-point of 3.875%.
We still have another 25 days to the next FOMC meeting on December 9th, and already the Treasury yield curve has reacted sharply, with the 2-year Treasury yield increasing 37 bp’s this week, and the 10-year Treasury yield increasing 29 bp’s on the week.
Personally, I continue to hope Treasury yields continue to rise before the December FOMC meeting. The high yield for the 10-year Treasury in early October (October 4th to be exact) was 5.349% or let’s say 5.35% for government work.
“Real” Treasury yields jumped to a 5-week high this week, but this blog has only begun to start tracking the metric. (The U.S. Department of the Treasury will send a daily email with closing yields, providing daily Treasury rate updates, in the event any one is interested.) Still current “real yields” are telling you Treasuries and corporate bonds are attractive.
Bond annual returns:
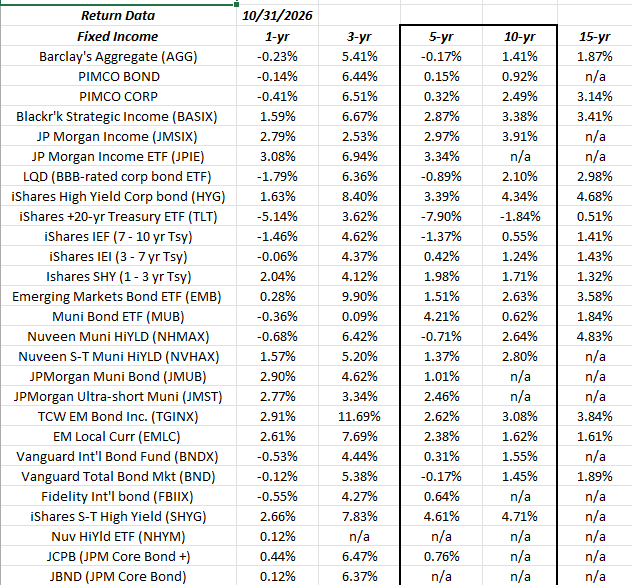
I thought long and hard about publishing this data, since it’s a rather “ad hoc” compilation of various bond funds, and ETF’s from various families, etc.
What I wanted to bring to reader and client attention though is the darker-bordered area of 5-year and 10-year annual returns for fixed income.
Look how low those annual returns are – that has to be close to “historic” lows and this decade will likely be one of the worst for fixed-income returns ever. I was taking a Money & Banking class in February, 1980, at a small Jesuit school in Cincinnati, Ohio, when the fed funds rate hit 20% and the 30-year Treasury was around 15%. The professor worked at the Cincinnati Federal Reserve branch and did a great job explaining open-market operations, under then-Fed Chairman Paul Volcker. And those all-time yield highs came full-circle in March, 2020, with the Covid mess, when the 10-year Treasury yield traded down to 40 bp’s and the 30-year Treasury yield traded down to 84 bp’s.
Another startling metric on the above spreadsheet is the TLT; the 10-year annual return for the 10-year Treasury as of 10/31/26 is now -1.84%. Ouch…
Summary: The mid-term elections were surprising in many ways, but the repudiation of the data-center buildout was a bit of a shock. Q3 ’26 GDP was released in late October ’26, along with PCE inflation data, and the strong 3.6% Q3 ’26 GDP growth rate (first look for Q3), saw half the GDP growth driven by non-residential fixed investment, which is Fed econo-speak for data center construction.
While it’s likely to take some time to slow that rate of growth, thinking about Jensen Huang and his rapid departure at Nvidia, the number one company driving the growth and most associated with the growth of AI. Readers by now have seen the supposed Venn diagrams of the AI infrastructure financing and the polite word is “circular” but it’s really quite incestuous. This Cisco earnings preview that was written somewhat hurriedly last Thursday, before Cisco released their Q1 ’27 results, has a Venn diagram embedded within of Nvidia’s relationships within the AI industry, and it’s why the earnings preview was ultimately cautious on Cisco. Despite a very good quarter by Cisco, the stock fell hard on Friday, 11/13, (i.e. -6%) as some of the tertiary players are likely to get squeezed first. (I’m not saying Cisco is one of those, but the stock only took out it’s April, 2000, high of $74 in 2026.
Even if Jensen fights the board dismissal, and comes back again to lead Nvidia, Nvidia ( the company) will be forever changed. Jensen’s likely to change his management style, and the Board will likely require another layer of two management to get away from all the direct reports, and if Jensen does come back it’s unlikely to be immediately given the pending testimony to Congress.
This blog has never owned Nvidia directly (through the QQQ’s), and has been underweight tech for the last 2 years, with financials helping with their total returns the last few years, but technology and financials comprise 48% of the SP 500 by market-cap weight, and the financial sector particularly the investment bankers like Goldman, Morgan Stanley and the big banks like JPMorgan, and Citi have benefitted from the capital market tailwind that has been gotten from AI capital raises and AI IPO’s. When the Anthropic IPO drops this week, the only big IPO left is OpenAI. These IPO’s tend to cluster around market tops as managements and bankers try to do the offering while the capital markets are still a tailwind. If Nvidia stops being the bank on so many of these AI deals, and the credit financings get more rigorous, the capital market attribution to the big financial players could start to dry up in ’27.
There was a graphic circulating on X, originating from Goldman Sachs, (hat tip to @MikeZaccardi on X) where Goldman estimated that 62% of the SP 500 has direct AI exposure, and presumably that’s financials, utilities (power demands) consumer discretionary (construction) industrials, etc. and not just technology alone.
By the way, any weakening of the AI buildout will likely aid the bond market(s) and possibly have a positive impact on inflation.
Nvidia fell 33% in roughly 6 weeks, from it’s $240 high in early October ’26. The stock fell from $150 to the $100 area during the “tariff tiff” in early ’25, but the catalyst this time is entirely internal to Nvidia.
The first 6 months of 2027, the tech and financial sectors have absolutely horrid compares versus the semiconductor numbers in Q1 and Q2 ’26, and then the SpaceX, and Anthropic and OpenAI IPO’s, and if financing slows the numbers could get worse.
One final metric to consider: Rick Rieder, the Blackrock Global Everything Guru, on his regular, last-Thursday-of-the-month morning webcast in late October ’26, noted that the top 20 names in the SP 500 were accounting for 92% of the SP 500 earnings growth.
And the winds of fate just took out the #1 stock and company, from #1 top performing sector in a most egregious way.
It’s time to look elsewhere.
None of this is advice or a recommendation but only an opinion. Writing the blog helps to articulate the arguments and see how they look in print. Past performance is no guarantee of future results. None of this information may be updated and if updated, may not be done in a timely fashion.
Thanks for reading. (Sorry to be so gloomy.)