
After META kicked off the hyper-scaler earnings this past week with a considerable dud, falling 9.4% this week after their earnings release, most of which is likely due to the considerable dilution to shareholders from the new non-voting common stock issuance (even though actual free-cash-flow was much better than expected), the following graph from the Bespoke Report showing mega-cap 5-year CDS spread trends might be a helpful start to readers before the Q3 ’26 reports.
What’s interesting is that the “name of the game” for investors around mega-cap tech, seems to be evolving to be less about the typical revenue, EPS and operating income growth, and earnings and revenue guidance, and more about sector capital, free-cash-flow and capex growth, debt issuance and the ability to raise capital, as well as the longer-term prospects for a firm’s credit standing, and by that is meant it’s senior unsecured, and long-term credit rating.
CoreWeave, with a $30 billion market cap, but $50 billion debt outstanding and credit default swaps (CDS) that have been widening quickly, seems to be the latest worry point for a sub-sector (hyperscalers), with plenty to worry about already. (Coreweave CDS do not appear on the graph below.)
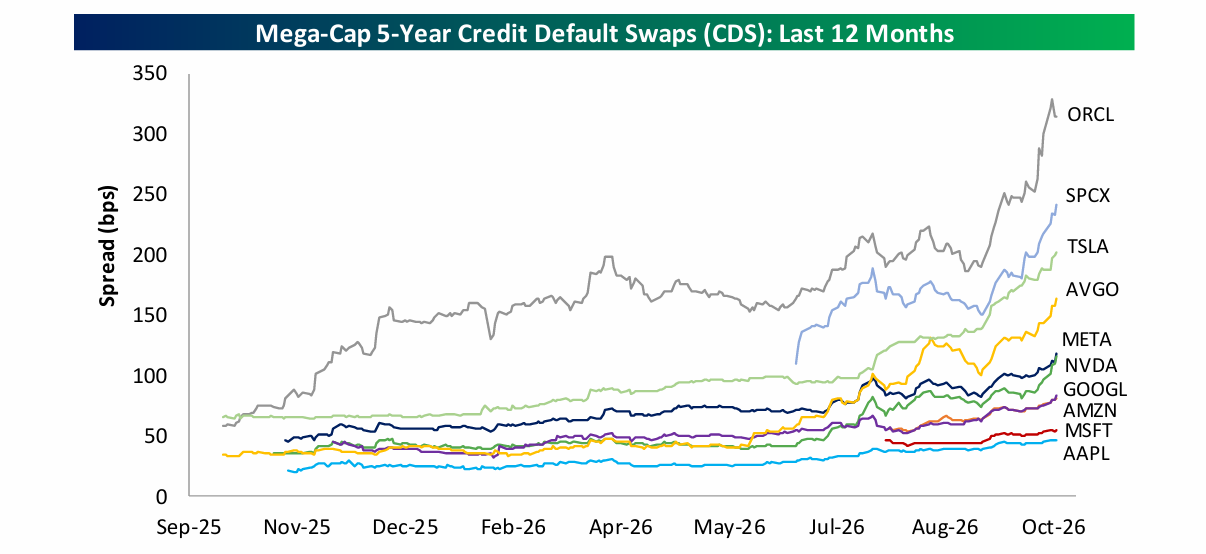
The first thought when looking at this graph at the Saturday morning breakfast, was that sticking with higher-credit quality companies, might mitigate some of the downside risk. (Meta was ranked 6th out of 10 in terms CDS credit spread widening, which left me wondering about companies 6 through 10).
Here’s the YTD common stock total-returns as of the Friday, 10/23/26 close:
- Alphabet (GOOGL): +2.51%
- Microsoft (MSFT): +9.02%
- Amazon (AMZN): +7.44%
Alphabet:
- Alphabet (GOOGL) is scheduled to report Wednesday night, October 28th after the market closes. Current sell-side consensus per LSEG is expecting $3.01 in earnings per share on $128.1 billion in revenue for expected year-over-year (yoy) growth of 5% and 25% respectively. The yoy growth of operating income is expected to be 23%, or $42.7 billion.
- The Sept. ’25 quarter was particularly strong for GOOGL, with actual EPS of $2.87 on a $2.33 estimate for a 23% upside surprise. Operating margin came in a 160 bp’s better-than-expected, as Google Cloud really had a great quarter. The expected 5% EPS growth for Sept ’26 does have a tough compare with last year.
- For both the March and June ’26 quarters, the Anthropic mark-up (paper gain) distorted GOOGL’s earnings growth. The current full-year ’26 EPS estimate for GOOGL is $20.61 for an expected calendar-year EPS growth rate of 91%. On a core, operating EPS rate, the growth rate for GOOGL’s 2026 EPS should be closer to mid-30% to high 30% range.
- For Q4 ’26, META raised guidance for Q4 ’26, with consensus for GOOGL looking for $3.36 in earnings per share on $143 billion in revenue for expected yoy growth of growth of 19% and 25% respectively. Since META raised the low end of their capex guidance, it was an indication that the willingness of the hyperscalers to massively spend is still intact.
With the Anthropic IPO scheduled for November ’26, there is expected to be further mark-ups in this Sept ’26 quarter to be reported Wednesday night.
Valuation:
On a PE basis, GOOGL is cheap, trading at 16x EPS for an expected 91% growth rate, albeit distorted by Anthropic, while 2017’s current EPS estimate of $15.27 is sporting a 21x multiple.
The cash-flow is the issue since GOOGL went free-cash-flow negative last quarter for the first time in – well – a long time.
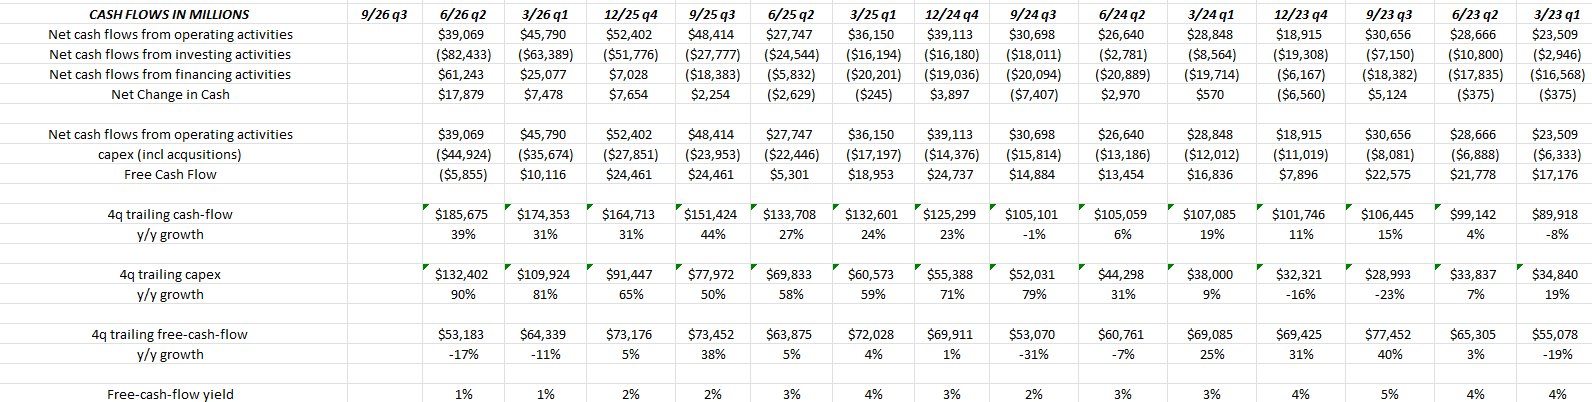
Here’s GOOGL’s cash-flow statement so readers can look at the numbers: the free-cash-flow yield has fallen to 1% as of June 30, and the price to cash-flow and price to free-cash-flow (FCF) is 21x and 73x.
GOOGL is trading at a 25% discount to Morningstar’s estimated fair value or intrinsic value of $433.
Technically the stock is now trading below it’s 200-day moving average, which is never typically a good sign. A trade back up to and through the all-time-high of $400 would be a significant plus.
GOOGL’s key stats:
- TTM FCF yield: 1%
- Capex as % revenue: 30%
- Capex as % of operating cash-flow: 71%
- Annual capex guide $180 – $190 billion
- Long-term debt: $80 billion
- Credit rating: Standard & Poors: AA+ / Moody’s Aa+
Google has similar issues to a lot of hyperscalers, i.e. dwindling free-cash-flow, which is now negative as Q2 ’26, no share buybacks helping support the stock, capex growing rapidly, and long-term debt that has jumped to $80 billion from $21 billion just 4 – 5 quarters ago.
Other companies in which Alphabet holds private stakes, like Anthropic, are YouTube, Waymo, and SpaceX. These companies could potentially be a source of cash for share repurchases, debt paydown and other uses, although the long-term credit rating today is a source of comfort, not to mention providing the GOOGL shares a valuation boost.
Microsoft:
- Along with Alphabet, Microsoft is scheduled to release their fiscal Q1 ’27, Wednesday October 28th, after the market close, with consensus sell-side expectations looking for $4.72 in earnings per share on $90.6 billion in revenue and $44 billion in operating income for respective yoy growth of 14%, 17% and 16%.
- Last quarter, fiscal Q4 ’26, Microsoft’s stock jumped from $400 to almost $500 after results, from a strong beat on EPS (6% upside surprise as well as a 3% upside surprise in revenue). Azure yoy growth was better-than-expected and even MSFT’s other two segments i.e. Productivity & Business and Personal Computing saw upside to estimates.
- The coming quarter for MSFT, fiscal Q2 ’27 ended Dec 31 ’26, is looking for 18% revenue growth, 17% operating income growth and 17% EPS growth.
The key aspect to MSFT’s financial results is that free-cash-flow is still quite healthy, coming in at $19.6 billion in fiscal Q4 ’26 ended June, versus Alphabet’s and META’s quarterly free-cash-flow which is now negative.
Valuation:
At $525 per share, MSFT is trading at 27x, expected fiscal ’27 EPS of $19.73, which is distorted by the Open AI mark-ups of December ’26. The expected EPS growth of 8% in fiscal 2027 is well below MSFT’s annual EPS growth rate of 20% since fiscal 2020.
Capex was guided to $40 billion for fiscal Q1 ’27 and for full-year fiscal ’27 the Microsoft slides only noted that capex will grow yoy, but after spending $115 billion in fiscal ’26, and now expecting $40 billion in Q1 ’27, it looks like MSFT’s expected capex range for ’27 is somewhere between $120 to $160 billion (or maybe more).
Morningstar has a $600 fair value or intrinsic value estimate currently on MSFT, which leaves MSFT currently trading at a 10% – 12% discount to fair value.
MSFT’s key stats:
- FCF Yield: 2%
- Capex as % of revenue: 35%
- Capex as % of operating cash-flow: 64%
- Annual (’27) capex guide: $120 – $160 billion
- Long-term debt: $31 billion, down from a peak of $44 – $45 billion in Dec ’23 quarter
- Credit rating: AAA from S&P / Aaa from Moody’s
Microsoft remains one of the few companies in the US that retains it’s AAA/Aaa credit ratings from both Standard & Poors and Moody’s.
Amazon:
- Amazon reports their calendar Q3 ’26 after the closing bell on Thursday, October 29th, 2026. Street consensus is expecting $1.96 in earnings per share on $202 bl in revenue for expected yoy growth of 1% and 12% respectively. Operating income growth is expected at 5% yoy.
- In q4 ’26, current consensus expects Amazon to print 26% EPS growth and 15% revenue growth as Amazon moves through the Anthropic quarters and mark-ups.
- Amazon like GOOGL is or was impacted by Anthropic’s mark-ups so like GOOGl, Amazon is expecting a drop in 2027’s EPS versus 2026 all or the vast majority of which is caused by the non-operating gains from Anthropic. Expected Amazon 2026 EPS is $12.81 and expected ’27 EPS as of this weekend is $10.62.
- In Q2 ’26 AWS (Amazon Web Services), per the conference call notes, saw it’s fastest growth in AWS in 18 quarters and AWS revenue and operating margin was the whole attribution for the quarter.
From the internal spreadsheet, AWS is now 21% of Amazon’s total revenue, but 62% of Amazon’s operating income per the June quarter. (Here’s what’s interesting is that back in the Dec ’22 quarter, AWS revenue was 14% of total Amazon revenue while operating income for AWS was 59% of Amazon’s total. That is lots more revenue but absolutely no increase in income, which is the story for the whole sector.)
Valuation:
Amazon is trading at 20x expected EPS of $21.81 in 2026 and then 24x next year’s depressed EPS of $10.62. Amazon is trading at 18x cash-from-ops as of the June ’26 quarter but the price to free-cash-flow number is now negative given Amazon’s free-cash-flow is now negative.
Morningstar’s fair value estimate or intrinsic value estimate for Amazon is $300 leaving Amazon at it’s current price of $248, trading at an 18% discount to Morningstar’s fair value.
Amazon key stats:
- TTM FCF yield: -1%
- Capex as a % of revenue: 22%
- Capex as a % of cash-from-ops: 108%
- Annual capex guide: Didn’t see a # / Run rate gets to $225 bl by ye ’26
- Long-tern debt: $129 bl as of 6/26, vs $51 bl in June ’25
- Credit rating: AA S&P/ A1 Moody’s
Looking at the above numbers it makes more sense now why Amazon abandoned Amazon Fresh and Amazon Go (Walmart’s expected competition) and focused on existing Whole Foods stores since AWS is consuming an enormous amount of capital. You have to wonder how the ecommerce business and automation will fare, but maybe productivity enhancement at e-commerce is part-and-parcel to Amazon’s overall AI spend .
Amazon could possibly be the first US company to print $1 trillion in revenue, possibly by the end of ’27 but more likely by the end of ’28. While Amazon has now surpassed Walmart as the largest company in the US by annual revenue, that isn’t “retail-to-retail”. Walmart is still the largest US retailer, and maybe in the world with it’s expected $753 billion in revenue in their fiscal ’27 (ends January, ’27).
Amazon’s capex as % of cash-flow at 108% is truly remarkable.
Summary: With capex determining free-cash-flow around the AI-related stocks, and free-cash-flow being the primary valuation component ( at least in terms of the discounted cash-flow model), the science of valuation has become the art of valuation.
Things are all over the map today, much like the internet days of the late 1990’s when “eyeballs” were one valuation metric, as well as a few others. This blog post from May, 2024, talks about – even back then – capex straining the various AI companies – and the fact is – if readers look at the key stats and some of the commentary, capex has gotten even worse, with the capex guidance getting even stronger.
Amazon’s capex clocking in at 108% of “cash-flow” (as in cash-flow-from-operations) is a heady statistic and probably pretty telling.
If this blog were to rank the above-previewed names for willingness to own (excluding any seemingly apparent valuation discount), here’s the rank:
1.) Microsoft: the AAA / Aaa credit rating, the remaining free-cash-flow cushion, the fact that Microsoft has reduced their l-t debt over the last 3 – 4 years, with the idea behind that being issuing debt would be a lower cost of capital than issuing equity, and the capex as a % of cash-from ops is the lowest of the three at 61%.
2.) Alphabet / GOOGL: it’s a tough call with Amazon but again, the capex as % of cash-from ops (71%) is the most important factor in the ranking at this point. Another factor peculiar to GOOGL is the SpaceX, Waymo and YouTube investments, which – all other factors being equal – should mean GOOGL is trading at a bigger discount to intrinsic value than what is telegraphed. Alphabet just went free-cash-flow negative for the first time in the June quarter.
3.) Amazon: Amazon has now been free-cash-flow negative for two consecutive quarters hence the “capex as a % of cash-from-ops” is the highest of the three companies listed above at 108%. It’s quite possible every AI-related company that is massively increasing capex could get there. Amazon isn’t “bad” by any means, but I wonder how capital for the retail or e-commerce part of Amazon’s business (ex-AWS) being 78% – 80% of the revenue still gets allocated. Does the fact that Amazon has e-commerce and retail competing with capital for AWS, or complementing capital for AWS or both ?
Like the capex ratio, if we ranked each company by their credit ratings from Standard & Poors and Moody’s, the ranking would be the same.
Microsoft seems to be the safer bet coming into these September quarter earnings, but outsized capex guidance, particularly for calendar 2027 if companies should choose to give it, will be the defining metric. The greater the upside to capex, the lower the forward estimates to free-cash-flow.
It was noted with META, that their capex was lower-than-expected, which led to a ($2 bl) free-cash-flow quarter, much better than the ($8.5 bl consensus estimate) negative FCF expected.
Torsten Slok, the head guru over at Apollo Capital, recently wrote that outside of the AI sector, there has been “no sign of an AI payoff” for the rest of the SP 500.
None of this is advice or a recommendation, but only an opinion. Past performance is no guarantee of future results. All EPS and revenue estimates are sourced form LSEG as were the company credit ratings, sourced from LSEG. None of this advice may updated, and if updated, may not be done in a timely fashion.
Thanks for reading.