
Both JPMorgan (JPM) and Citigroup (C) are scheduled to report their Q3 ’26 financial results before the opening bell on Tuesday morning, October 13th, 2026.
Bank of America (BAC) will report their q3 ’26 before the opening bell, Wednesday morning, October 14th.
JPMorgan (JPM):
When JPM reports their Q3 ’26 financial results before the opening bell on Tuesday, October 13th, street consensus is expecting EPS of $5.90 and net revenue of $51.5 billion, for expected year-over-year (y-o-y) growth of 16% and 11%, respectively.
Full-year ’26 estimates are currently expecting that the banking giant will see 24% EPS growth and 15% net revenue growth.
In Q2 ’26, JPM net revenue grew 15% while EPS grew 24% yoy, primarily thanks to the equity market performance from April through June ’26. Equity trading and equity-related revenue rose 86% in Q2 ’26, up sharply from Q1 ’26, which was just 17% at that time, so Q3 ’26 will likely see a similar return to a more normal equity quarter. Fixed-income – at least the 2nd half of the quarter from mid-August ’26 – should also see tempered revenue growth.
JPM’s results by segment:
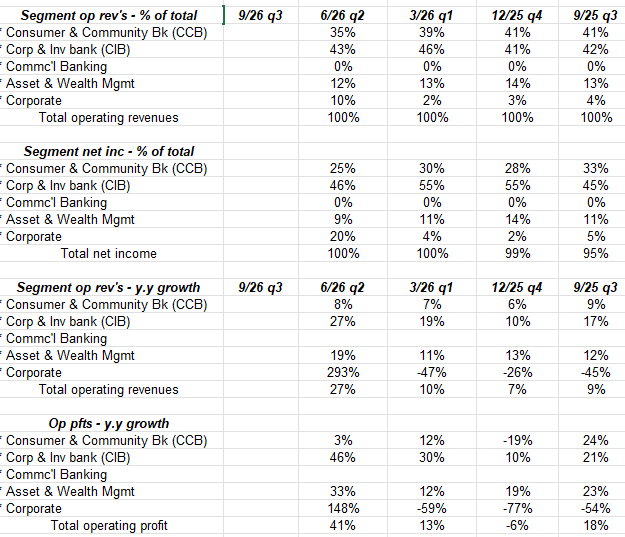
Click on the above spreadsheet and look at Q2 ’26’s results. JPM’s corporate and investment bank is where the capital markets group resides, so that will likely mean a peak in y-o-y growth for the segment all the way through Q2 ’27. The Anthropic write-up, the SpaceX (SPCX) IPO and the overheated semiconductor market from May and June ’26 all added to a verry strong quarter for the money-center banks, investments banks, and any market-related entity that generated any trading revenue.
More under-the-surface, but still a very real contributor to earnings growth is that JPM has repurchased $30.1 billion in common stock from Q2 ’26 back through Q3 ’25. Since Q4 ’24 through Q2 ’26, JPM has repo’ed 7.5% of it’s common shares.
As of 10/8/26, stock is down about 10% from it’s all-time-high of $366 and is now oversold on the daily chart. The selling has been pretty steady since mid-August, once it became obvious the FOMC was going to raise interest rates.
JPM is trading at 13x expected 24% EPS growth in full-year ’26, and then that EPS growth tempers to 0% in ’27 and 8% in ’28.
Off all the big banks, JPM trades at the highest price-to-book multiple at 2.5x, but JPM has also generated the highest return-on-tangible common equity (ROTCE) in the low 20% range for the last 2 – 3 years.
Citigroup (C):
When Citigroup reports it’s Q3 ’26 quarter on Tuesday morning, October 13th before the opening bell, analyst consensus expectation for EPS is $2.66 in EPS and $23.7 billion in revenue for expected EPS and net revenue growth of 43% and 7% respectively.
Current full-year ’26 EPS and revenue growth estimates are expecting 48% EPS growth and 13% revenue growth for the bank that is still trying to dig out of 2008 and then Covid in 2020.
In the last 7 quarters, Citigroup has averaged 39% y-o-y EPS growth, which assumes the $2.66 is at least met for Q3 ’26.
In Q2 ’26 Citi generated 14% net revenue growth and from that investor saw 61% EPS growth. Citi reported a 13% ROTCE, but then guided to 11% for the full-year so there was some confusion, but Citi benefitted from capital markets activity as did JPMorgan, which may not repeat the next 2 quarters.
Like JPM, Citi repurchased $18.45 bl in common stock the last 4 quarters, and has reduced fully diluted shares outstanding by 10% since Q4 ’23.
Trading at just over 1x book value, Citi is more the value play of the two banking giants, but Citi has a much lower ROTCE than JPM’s. Citi is trading at just 11x expected 48% EPS growth in ’26, while 15% EPS growth is still expected in ’27 and ’28.
Bank of America (BAC):
Bank of America is scheduled to report their 3rd quarter, 2026, financial results before the opening bell on Wednesday October 14th, ’26.
Before the numbers are posted, the one aspect to BAC’s estimates for Q2 ’26 and for calendar year estimates is that – of the three big banks – BAC is the only BAC to see lower estimates for Q3 ’26 today, than following the 2nd quarter results.
BAC says in the 10-q that they are asset-sensitive, but the bank trades like it’s liability-sensitive.
For BAC, street consensus is expecting EPS of $1.19, on $31.3 billion of net revenue for expected y-o-y growth of 12% and 11% respectively. Those expected results are in-between JPM and C, while expected full-year BAC results are expecting 20% EPS growth on 12% net revenue growth.
Like C and JPM, BAC’s equity trading grew 70% in Q2 ’26, with a 50% boost in investment banking revenue.
It was a GREAT quarter for BAC – aided substantially by capital markets – with ROTCE coming in at +17%.
Today, BAC is trading at $54 per share, down from a high of $65, and is trading at 12x expected EPS this year of 20% growth, and 12% net revenue growth.
The problem is the comp’s get tougher for the big giants, and BAC’s negative revisions, albeit slight revisions are different than JPM and Citi’s expected estimates.
Here’s a look at key metrics for each bank:
Expected EPS growth:
- JPM: 24% in ’26, 0% in ’27, 8% in ’28
- Citi: 48% in ’26, 15% in ‘27%, 15% in ’28
- BAC: 20% in ’26, 14% in ’27, 12% in ’28
Expected net revenue growth:
- JPM: 15% in ’26, 3% in ’27, 5% in ’28
- Citi: 13% in ’26, 3% in ‘27%, 5% in ’28
- BAC: 12% in ’26, 6% in ’27, 5% in ’28
Current PE ratio’s based on current estimates:
- JPM: 13x ’26, 13x ’27, 12% ’28
- Citi: 11x ’26, 10x ’27, 9x ’28
- BAC: 12x ’26, 10x ’27, 9x ’28
ROTCE (avg):
- JPM: 20% – 21%
- Citi: under 10% mainly, trying to improve it. ’26 goal is low teens
- Bac: mid-teens
Share repurchase dollars last 4 quarters:
- JPM: $30.9 billion
- Citi: $18.45 billion
- Bac: $26.74 billion
Conclusion / summary: The banking system remains in as good of a financial condition as it’s been in, in the last 30 years. Capital is in good shape, and is being returned to shareholders via dividends and buybacks, credit remains in very good shape, on a macro level, as the US consumer remains in fairly good shape. Credit card delinquencies and charge-offs – at least for the banks above – show little deterioration thus far. The housing and mortgage business will likely be subdued given interest rates and now the +7% 30-year mortgage rate.
With a 10-year Treasury yield at 5.30%, even if the FOMC raises the fed funds rate in December ’26, assuming no change in the yield curve, there will still be a positive slope between the fed funds and 2-year Treasury, but maybe not to the extent that the it’s greatly accretive to earnings.
Net interest income (NII) and net interest margin (NIM) could be a push for the big banks in late ’26, and 2027.
The substantial capital market trading and banking gains will likely moderate into early 2027, and the banks face very tough comp’s next year in the first half of ’27.
All this being said, expect bank EPS and revenue growth to moderate in coming quarters. The Anthropic IPO should it happen in November ’26 will add to 2026 results, but it’s more the ’27 results that will likely look more subdued.
Technically, the three banks mentioned above are all “oversold” testing their 200-day moving averages, and could see a decent bounce after earnings are released.
Citigroup is the best “value” play, given the low-but-improving ROTCE, and Jane Fraser’s continued efforts to pare unproductive assets and improve profitability. JPMorgan is the best bank (period) given Jamie Dimon’s efforts. Jamie has created an American financial juggernaut, and with JPM, investors get both capital markets exposure and a POBB (plain old banking business) in one. But JPM’s valuation remains at a premium given it’s leadership position, so it has the most to lose if the ideal industry conditions, turn south.
Bank of America is interesting because Berkshire has been paring back the position, and it’s the least “momentum-y” of the old money centers. The size of the buyback surprised me. A bank like BAC could hold it’s value better in a market that punishes banks since it’s the most out-of-favor.
JPM is this blog biggest position of the above-listed banks, with Citi and Bank of America following. Both JPM and C are in this blog’s Top 10 holdings as of September 30 ’26.
These banks are cheap on a PE-to-growth basis, and now testing their 200-day moving averages.
None of this is advice or a recommendation but only an opinion. Past performance is no guarantee of future results. All EPS and revenue estimates are sourced from LSEG, this blog’s sell-side estimate provider. None of this information may be updated and if updated, may not be done in a timely manner.
Thanks for reading.