
Boeing (BA):
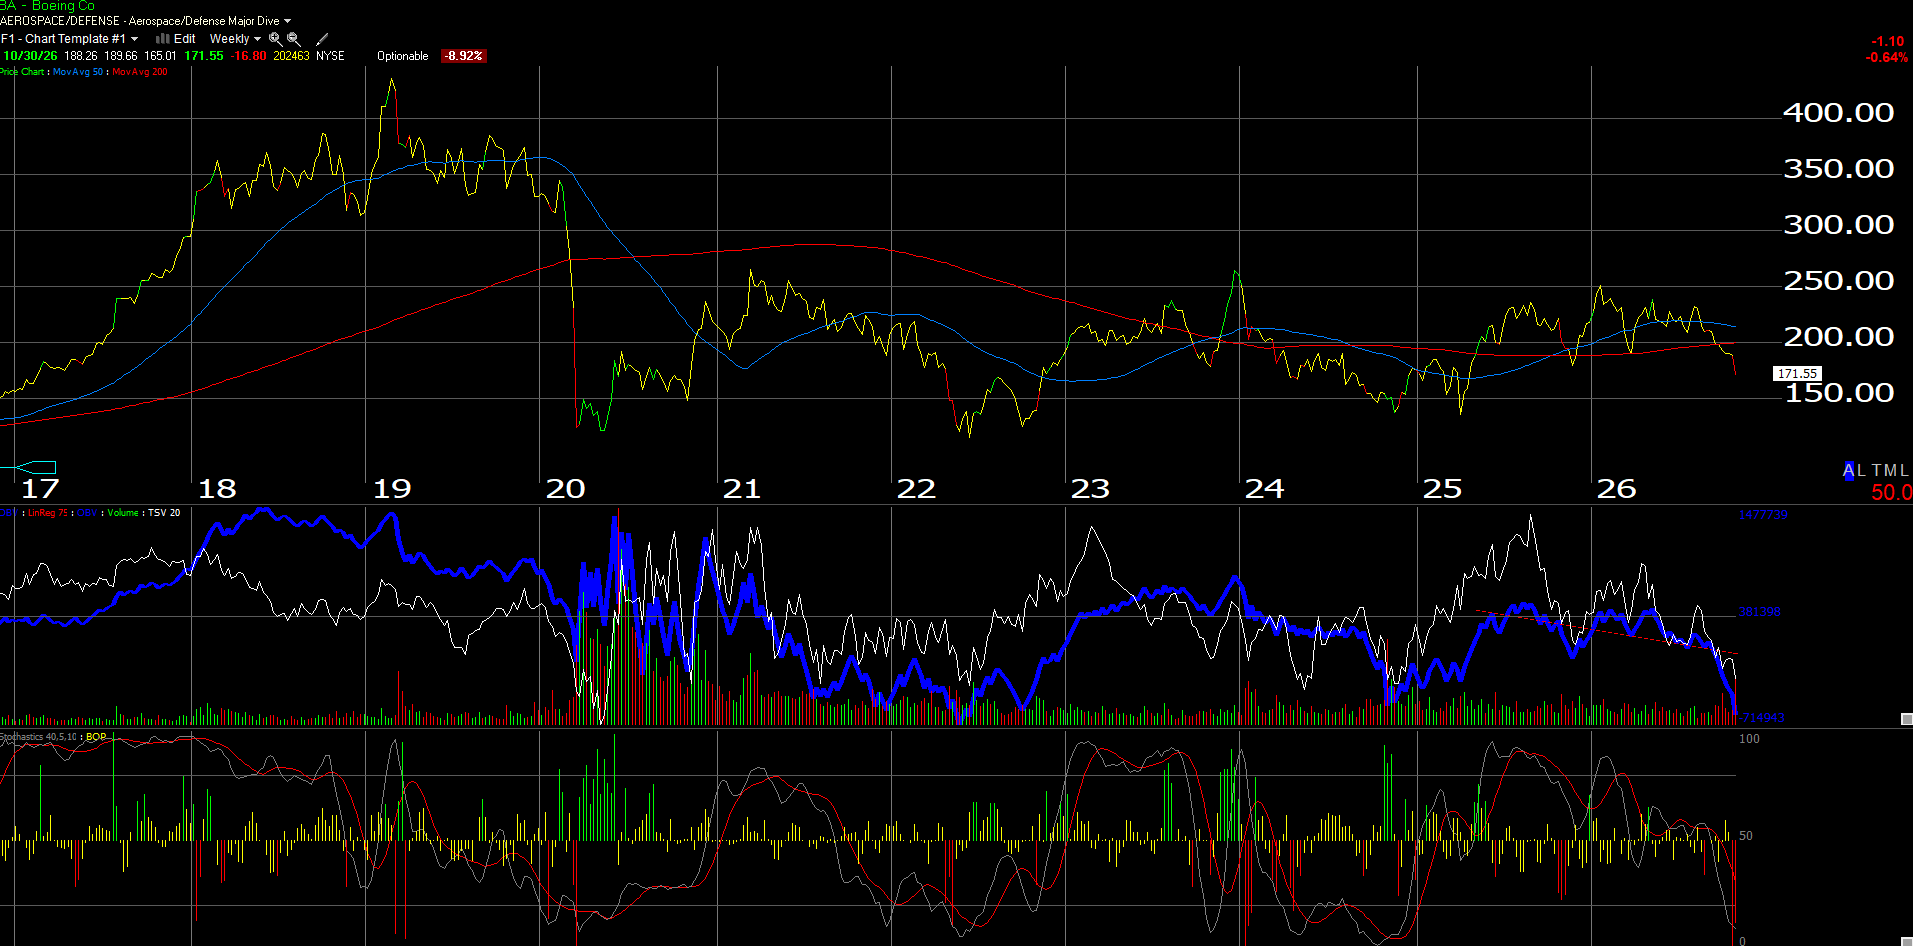
A weekly chart will start the update of Boeing’s (BA) price action, as readers can see that the stock has traded in a range between $140 – $150 on the low side and $250 on the high side for the last 6.5 years, and after last week’s bombshell that disclosed that $10 billion in free-cash-flow likely won’t be seen by Boeing shareholders until 2029, the stock is making it’s way back down to the low end of the 6.5 year trading range.
One technical positive is that BA is now getting very oversold on the weekly chart (bottom 1/3rd of the chart, lower right hand corner) but that means little for potential upside.
Besides the free-cash-flow pushback for BA announced last week, it was also disclosed that the 737 production ramp is being kept at it’s current 47 planes per month production rate, which won’t be lifted to 52 as was previously thought.
The reason BA is held in client accounts, is that after an 18-year secular bull market, holding a stock that is down 62% from it’s early 2019 high of $446 should help assuage the potential of BA really falling much further, after it’s drop in 2019.
Morningstar has a a fair or intrinsic value on BA of $246 to $250 per share, and that $250 level has acted as resistance (and a good point to sell the stock) in late 2021, early 2023, and early 2026. My own opinion is Morningstar’s analyst did a good job on the valuation of Boeing. Jefferies analyst also has some good work on BA, with a LOT of detail for portfolio managers, valuing the shares at $230. Jefferies analyst Sheila Kahyaoglu notes that free-cash-flow only gets to $6 bl by 2028 before $10 bl by 2029, so 2029’s objective is still a bit of a leap.
After last week’s earnings report, expectations have cratered for BA, which is (perhaps) not a bad thing. Without being able to ramp production though, BA – which is nearing peak revenue of $102 billion with 2026 full-year 2026 revenue expectations of $96.5 billion – cannot leverage the income statement. BA’s P/L is an absolute mess, with EPS being negative for 22 straight quarters, generating a cumulative EPS loss over those 22 quarters of ($58.72). Operating income is not much better.
Here’s a performance chart from YCharts showing BA’s relative performance vs the SP 500 since 1/1/2020:
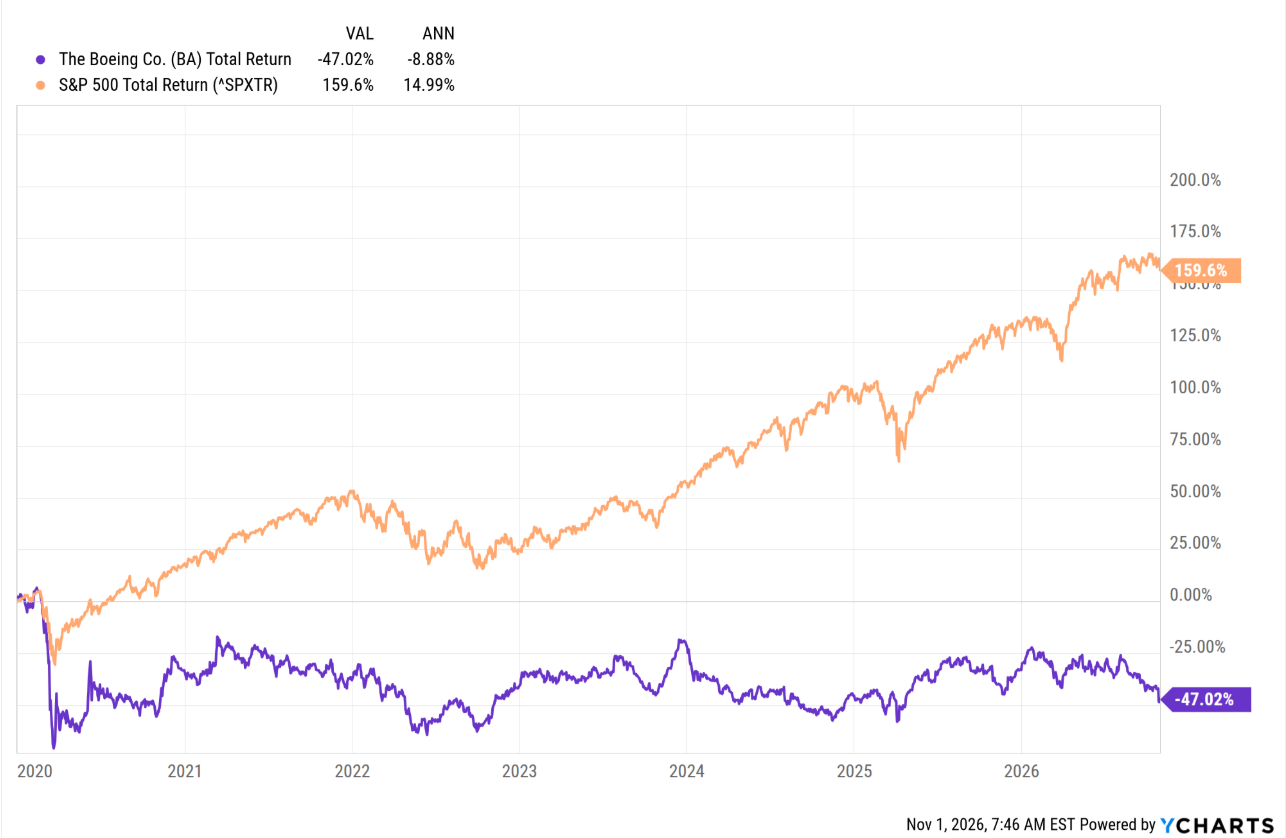
Chart source: YCharts
That’s not pretty.
Boeing may not be readers cup-of-tea, but you have to remember, Boeing is still only 1 of 2 airplane manufacturers in the world with the size and scale to do what they do. Morningstar still assigns BA a wide moat, deservedly so, but the FAA is going to get their pound of flesh after the two airline crashes in 2019. ( Like Wells Fargo and the asset cap following the account debacle, and now the FAA all over Boeing, the lesson here is never piss off or embarrass a regulator.)
This blog will hold the shares for now, but it could become a source of funds in some accounts depending on what the market does, that really depends on what else shows up that might be more compelling.
IBM (IBM):
How about a tech company whose capex is declining, free-cash-flow is growing, and the business hasn’t had to run pell-mell to the capital markets for additional capital, and – after the debacle in Q2 ’26 around software and “AI” – has suddenly righted the ship and reported a decent quarter for Q3 ’26.
Yes, that’s IBM. If you are looking for an “anti AI” tech stock, you may have found it with Big Blue.
IBM reported revenue, operating income and EPS growth in Q3 ’22 of 5%, 8% and 11% respectively, which, while far less than the hyperscaler and cloud crowd, is still respectable for the old mainframe giant. Software grew 9% y-o-y and software margins increased 210 bp’s in Q3 ’26. RedHat grew 11% with management commenting that RedHat would grow double-digit into year end.
The big mess after Q2 ’26 was the deal slippage on larger software deals, but IBM noted that 2/3rd’s of those deals were recovered in Q3 ’26.
Like Boeing, IBM has traded up through $300 on quantum computing headlines, and then in Q2 ’26, sold off down to the low $200’s but held above the old April, 2013 high of $215, that contained the stock from 2013 until late in 2024.
The interesting fundamental metric around IBM is that as the former tech giant of the 1980’s has moved more towards the software business and away from big iron and data management, IBM’s capex is just 1/3rd or even 1/4th of what it was in the late part of last decade.
IBM sports a free-cash-flow yield of 6% after the Q3 ’26 earnings report and has stopped repurchasing stock. IBM also sports a 2.6% dividend yield after last Friday’s close so unlike BA, which is paying no dividend, IBM investors get some capital return.
This blog’s earnings-based valuation model puts a $302 fair value estimate on IBM, while Morningstar’s model is more conservative at $230, thus averaging the two gets the reader to $266, which is close to where IBM is trading today. Like Boeing, IBM has this well defined trading range of +$300 on the high side to $215 on the low side, so readers can act accordingly.
IBM’s quantum division is still probably 2 years away, but the stock tends to rally sharply given IBM’s position in quantum.
This performance chart surprised me a little bit, charting IBM’s average, annual return, vs the SP 500’s since 1/1/2020:
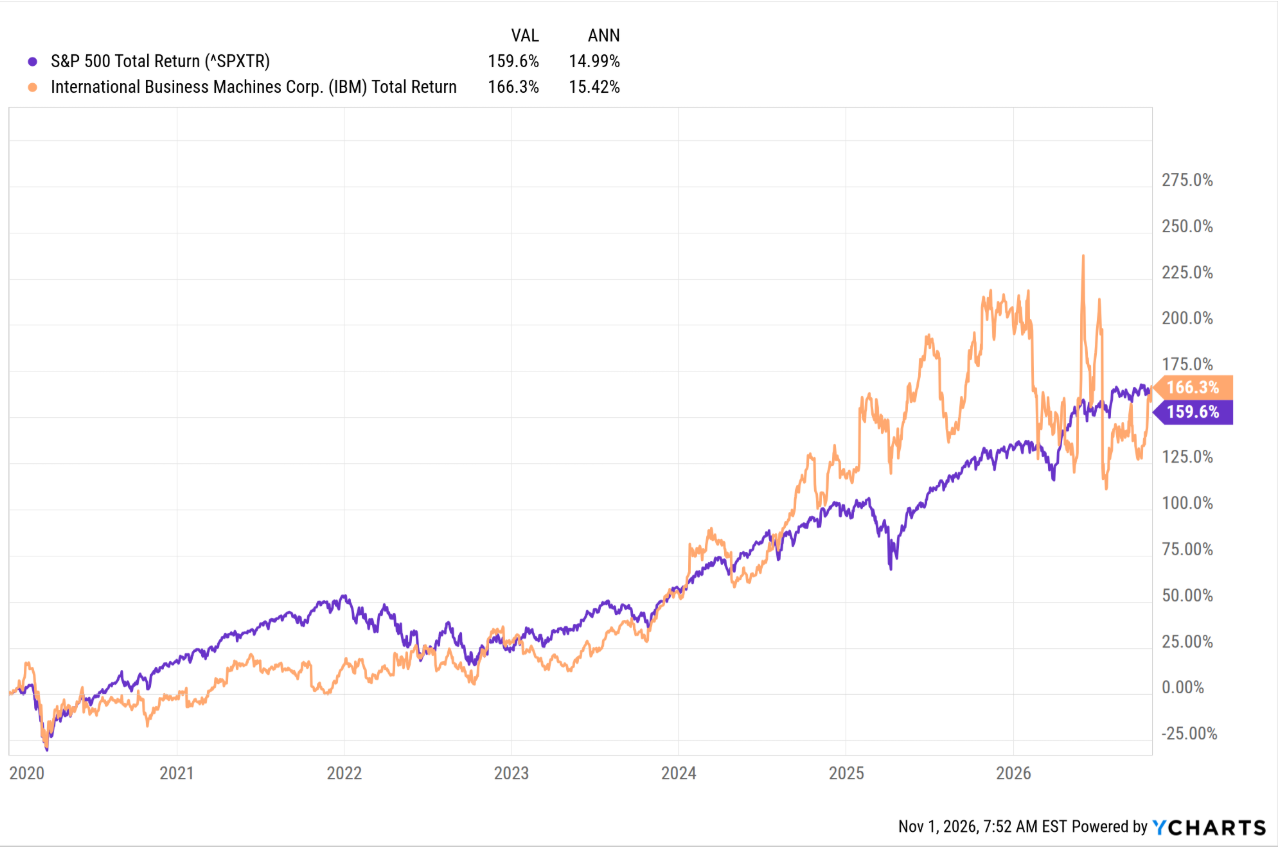
Chart source: YCharts
Summary: Holding stocks like Boeing and IBM may make little sense to readers, but if you’ve studied modern portfolio theory (MPT), the thought process around finding “uncorrelated” stocks, or sectors, or asset classes (like bonds) can help keep clients rational as bull markets unravel.
These positions can change at any time, which means the above-mentioned stocks can be added to, or trimmed if year-end tax loss selling presents itself.
There are many non-correlated’s that might be an easier fit within your portfolio as well. International had it’s best year since 2006 in 2025, so it’s still thought to be early in that allocation in terms of potential total return. Other defensive sectors like consumer staples, (which has actually performed very well), utilities, and healthcare have been less correlated to this longer-term bull market.
When the 1982 – 2000 historic bull market ended in March, 2000, the rotation into the long-time laggards like small and mid-cap (SMID), international, value sectors like commodities, staples, housing, etc. happened almost overnight. That doesn’t mean any future rotation will happen similarly – it could occur much more gradually – and the current market-cap leaders i.e. tech giants in the SP 500, don’t have to correct 80% like the Nasdaq did from March, 2000 to October, 2003, but could simply stagnate for years.
None of this is advice or a recommendation, but only an opinion. Past performance is no guarantee of future results. All earnings and revenue dated cited above is typically sourced from LSEG. Readers need to evaluate their own comfort with portfolio volatility and adjust accordingly. None of the above information may be updated, and if updated, may not be done in a timely fashion.
Thanks for reading.