The SP 500 closed at 6,000.36 on Friday, June 6th, 2025. It’s low on April 7th, 2025 was 4,835.04.
Despite the volatility in both stocks and bonds the last 12 – 13 weeks, here’s the YTD returns for the benchmarks:
- SP 500 (SPY): +1.25%
- Barclay’s Aggregate (AGG): +2.03%
- Balanced 60% / 40% portfolio: +1.56%
Despite the mainstream financial and regular media frenzy around tariffs, returns YTD have been a nothing-burger.
SP 500 earnings update:
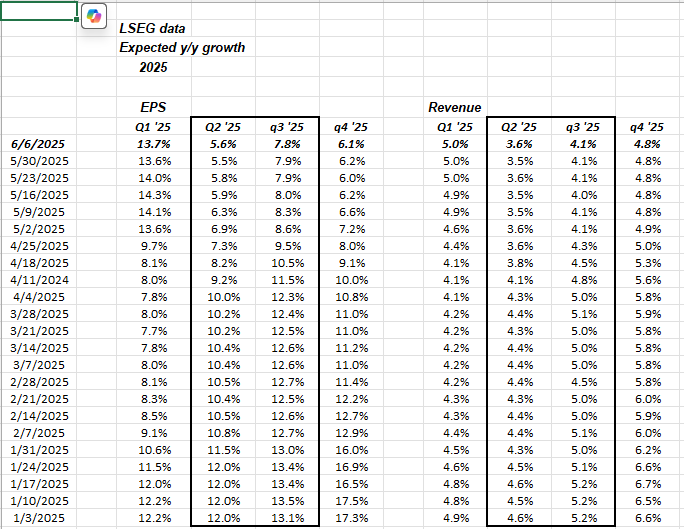
Here’s a table updated weekly from LSEG data that shows the trend in expected growth rates for Q2 and Q3 ’25 SP 500 EPS and revenue growth rates.
The growth rates actually ticked higher this week, (barely).
It’s another 4 weeks until we start seeing the actual Q2 ’25 earnings releases for SP 500 components, and the financials always kickoff the the first two weeks of earnings.
SP 500 data:
- The forward 4-quarter estimate (FFQE) ticked higher this week to $269.65 from last week’s $269.36, and is now $9 lower than the quarterly bump in early January of $272;
- The forward PE is 22.25x versus the PE on 3/28 of 20.8x;
- The forward earnings yield is 4.49%, down sharply from the early April ’25 spike to 5.50%;
- High yield spreads are unchanged the last 4 weeks, hovering around +323 the last two weeks (per the Bespoke data).
Another look at SP 500 EPS trends:
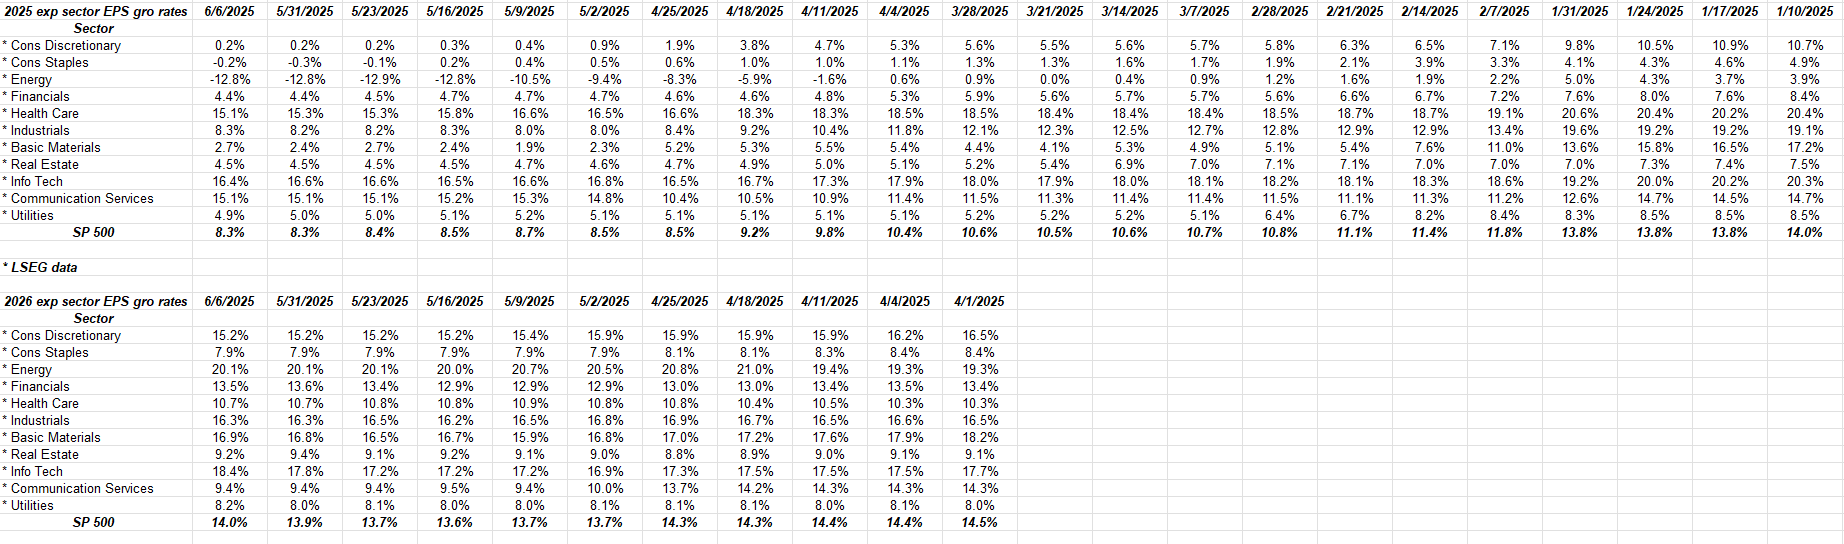
There are several time frames to look at SP 500 EPS and revenue trends, and one is checking the annual full-year expected growth every few weeks.
The expected SP 500 EPS growth rate is down from an expected 14% in early January ’25, to this week’s to an expected +8.3% this week.
Probably not a surprise to too many readers.
The technology sector’s interesting: check the steady decline in the expected 2025 tech sector EPS growth rate from 20% in early January ’25 to the 16.4% as of Friday, June 6th, 2025 (remember this is the full-year expected growth rate), while 2026 remains fairly steady.
Technology is still on track to have a solid year of sector earning growth, just a slower rate of growth than what was expected 5 months ago.
Summary / conclusion: Readers haven’t seen an earnings update in a couple of weeks, so the above tables reflect data as of June 6, 2025.
Barron’s ran a headline in the last few days saying that 75% of US companies have already raised prices to anticipate coming tariffs and yet the inflation data remains tame. That’s a valid point to make, but as the calendar rolls through the summer, we will start to see whether in fact the very good inflation data can remain “friendly” to the Treasury market.
The May CPI and Core CPI are due out Wednesday morning at 7:30 am, and expectations per the consensus (briefing.com) are for +0.3% and +0.2% respectively. With the rise in crude oil, I would have expected those numbers to be reversed and Core CPI closer to +0.2%, but let’s see what the data shows.
As long as the 10-year Treasury remains below 4.809% or the January 14th high tick, there is little reason to panic.
Finally the “inflation expectations” data began to crack recently, after the disconnect between the Treasury market and the inflation expectations data. The University of Michigan Consumer Sentiment data is due out Friday morning, June 13th, and within the sentiment are “inflation expectations” components. This blog wrote about the seeming disconnect between the “inflation expectations” data and the Treasury market trading action, here on May 7 ’25. Every Money & Banking and econ text I’ve ever read has noted that the critical aspect to inflation data is “inflation expectations” and not necessarily the actual inflation.
We’ll see how this dichotomy ends.
None of this is advice or a recommendation, but only an opinion. Past performance is no guarantee of future results. None of the information above may be updated, and if updated may not be done so in a timely fashion. Readers should gauge their own comfort with market volatility and adjust accordingly.
Thanks for reading.
Love you
that probably means you are short everything i’m long. But that’s ok. (haha).
thanks for the note.