There seems to be some nervousness and a little worry over Amazon as it prepares to report it’s Q3 ’25 financial results Thursday night, October 30th, after the closing bell, which is not a big surprise since Amazon reported a tougher 2nd quarter, with AWS (Amazon Web Services) losing roughly 2% market share to both Azure (Microsoft) and Google Cloud, and the AWS operating margin falling 260 bp’s y-o-y from 35.5% to 32.9% as of Q2 ’25.
Here’s the rub with Amazon: the retail giant is on track to do over $700 bl in revenue in calendar 2025 ($709 bl per the latest LSEG estimate), while the AWS segment revenue is just 18% of Amazon’s total revenue. However AWS’s operating margin is considerably higher (as a percentage of Amazon’s total operating margin) than that revenue percentage at 40% of Amazon’s total.
The point being Amazon today is basically Walmart with a cloud and emerging AI business attached to it i.e. Amazon Web Services (AWS).
AWS’s operating margin has been as a low as 24% in Q1 ’23, while peak operating margin happened in Q1 ’25 at 39.5%, so historically there is some volatility around the operating margin for AWS.
Analyst expectations coming into this Thursday’s quarterly release, are for Amazon to report $177.8 billion in revenue and $1.58 in earnings per share, as well as $23.7 billion in operating income for y-o-y growth of 12%, 10% and 4%. In Q2 ’25, Amazon’s revenue grew 13%, operating income +21%, and EPS +33%, all y-o-y, so no question expectations for Amazon’s Q3 ’25 y-o-y growth are more contained.
Usually Amazon intentionally lowballs or “underpromises” around it’s operating income guidance.
If you’d like to see how the AWS segment fits in to Amazon’s total financials, here’s the segment cut-and-pasted from this blog’s internal financial model, which shows a few-year history of AWS:
![]()
Source: internal spreadsheet from earnings reports
The bigger picture:
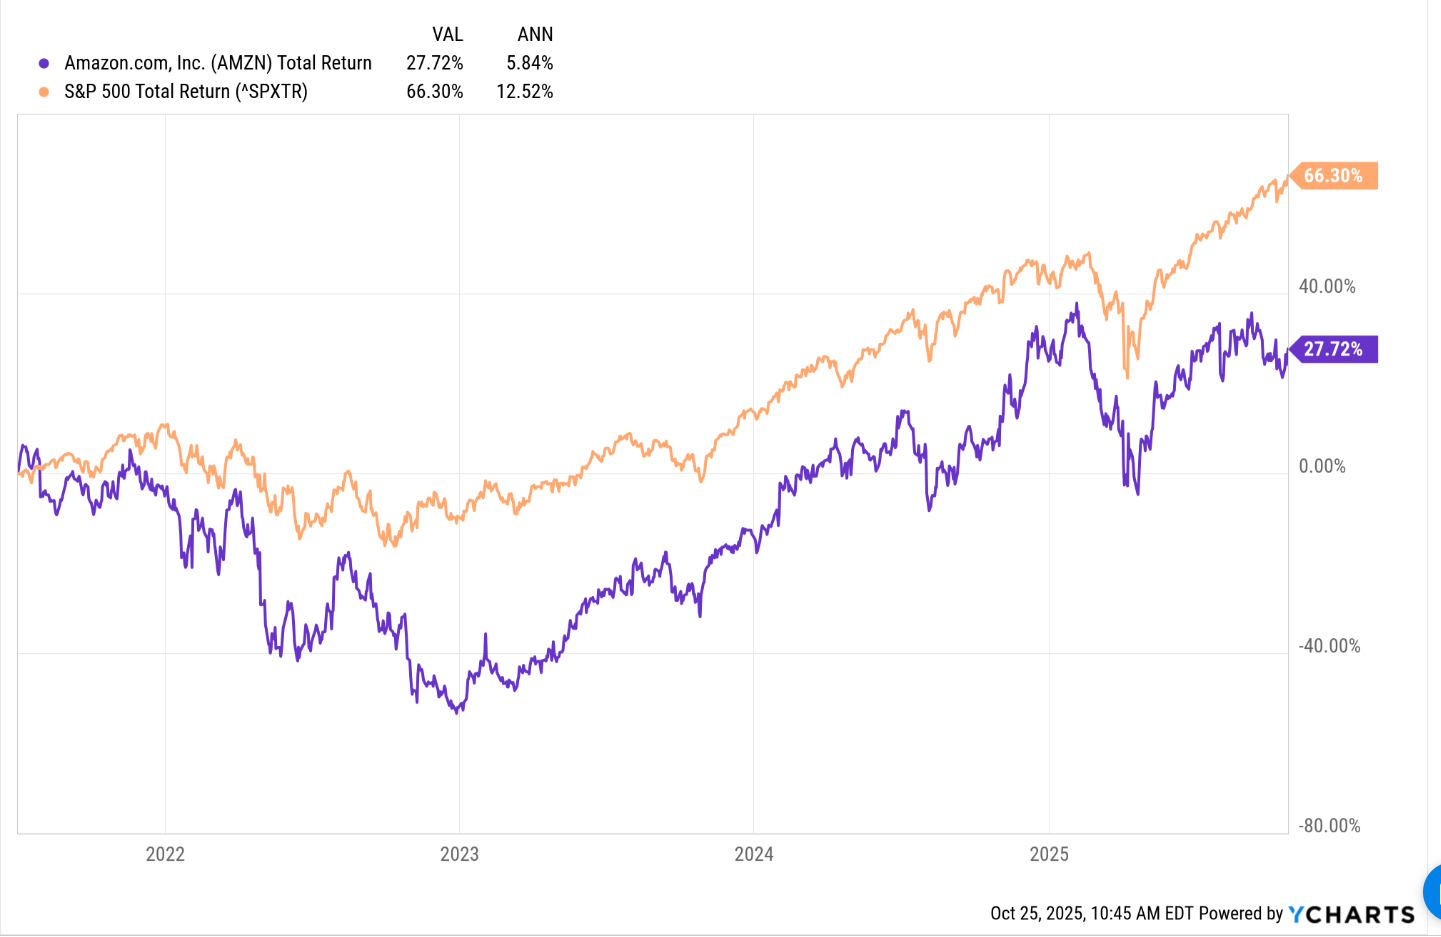
Chart source: Ycharts
Jeff Bezos officially resigned from Amazon on July 5th, 2021. The above chart shows the performance of Amazon’s stock price relative to the SP 500’s total return, from July 5th, 2021 as of October 24, 2025. Rounding the above numbers for time, Amazon’s total return in the last 4 years has underperformed the SP 500 total return by about 600 bp’s a year.
Part of this underperformance undoubtedly has been the selling of Amazon’s stock by both Jeff Bezos and his ex-wife McKenzie Bezos. I don’t have an exact figure on what Jeff Bezos has unloaded the last few years, but supposedly it’s a sizable amount of shares.
However lost in the departure of Jeff Bezos from Amazon was that revenue growth for the retail giant slowed from 22% in 2021, to 9% in 2022, and the last three years (’22 – ’24) of revenue growth has averaged just 11%.
More importantly, 2025’s expected revenue growth is just 9% and the next two years is just 10% (’26 and ’27) per year.
What’s driving this is that both Walmart and Amazon are on track to do $700 billion in revenue this calendar year (WMT’s fiscal ’26 ends January ’26, which is the year being cited, but 11 of the 12 months are calendar ’25). Ironically, per the LSEG analyst consensus estimates, both retail giants are scheduled to report $709 billion for calendar ’25.
This ties back into how AWS performs given the segment’s contribution to Amazon’s overall operating margin. Amazon revenue growth can continue to slow (and likely will), but AWS and that operating margin need to – at the very least – maintain the current margin levels – and hopefully not recede or get pressured, since it’s unlikely that Amazon’s retail operations will make up the margin difference.
Amazon by segment:
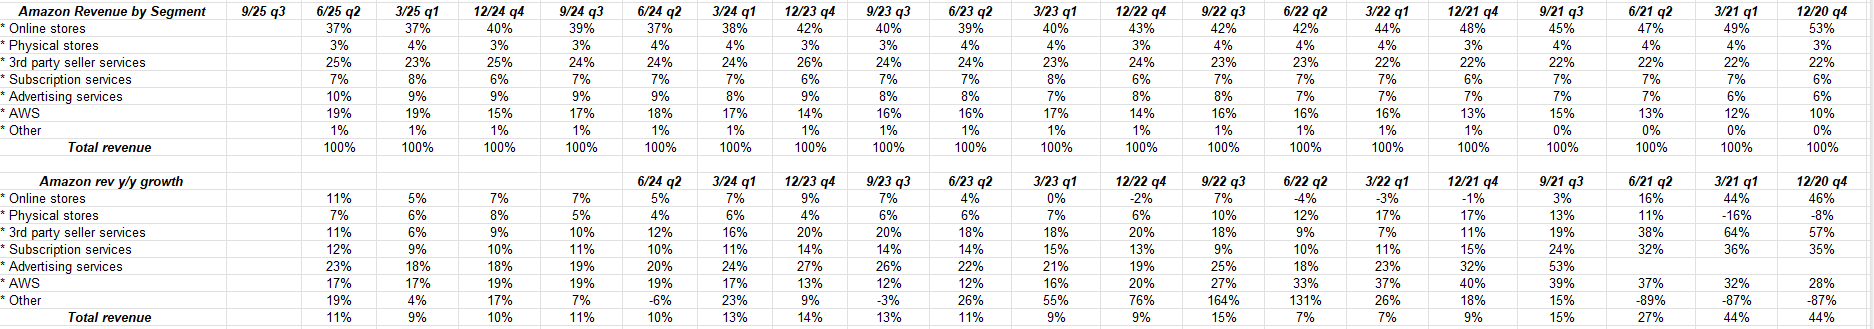
Clicking on this attached spreadsheet, will show readers how the various segments of Amazon’s business fit together.
Online stores soared to 53% of revenue during Covid, but the percentage of online stores in terms of Amazon’s total revenue has now receded to 37% part of that due to the continued growth in AWS but part also due to the emergence of advertising as a material line-item for Amazon.
Advertising services – now 10% of Amazon’s total revenue – has doubled in terms of Amazon’s total revenue contribution from the Covid days, and was the fastest growing of Amazon’s 7 segments last quarter with revenue growth that was +23% y-o-y.
Advertising is now part of Amazon’s emerging “flywheel” revenue as the e-commerce giant needs to broaden revenue sources (much like Walmart is doing).
What I like about the advertising business is that it’s “margin-rich” with higher margins (presumably) than straight ecommerce retail, and hopefully comparable or better than AWS.
EPS and revenue estimates: Still Improving
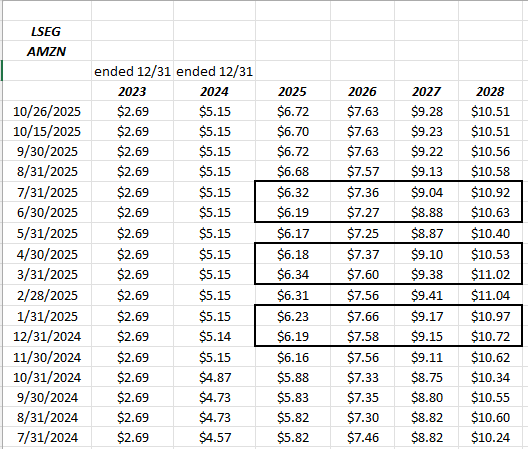
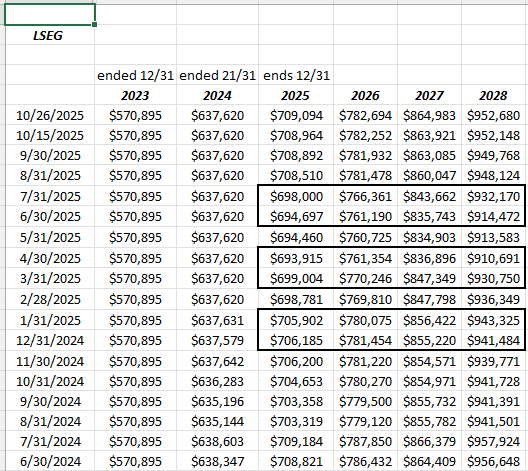
Source: LSEG consensus EPS and revenue estimate revisions
The rows for both Amazon’s consensus EPS and revenue estimates, show the change after the quarterly reports in March, April ’25, and then June, July ’25. We’ll have to wait until this week is done to see what October 31 metrics hold.
The March – April ’25 EPS estimates showed the impact of the tariff implementation, while the June – July ’25 EPS recovered much of the previous negative revisions.
EPS estimates are showing continued growth over the last 16 – 18 months, while the revenue estimates have remained mostly flat.
Summary / conclusion:
So how can all the metrics and data be summed up ?
Amazon’s heady +20% revenue growth is permanently slowing since 2021 – 2022. It’s the AWS operating margin and the success of the advertising business that will help sustain Amazon’s operating income growth in coming years.
Amazon and Walmart are now both heading for +$700 billion in revenue, which I think would be a first for an SP 500 company. Maybe Exxon-Mobil did it back when crude oil was near $100, but it’s fascinating to me that both Amazon and Walmart have achieved or are expected to achieve this key milestone this year.
Amazon’s non-GAAP operating margin has averaged 13.4% the last 9 quarters. Amazon did not achieve a 5% operating margin until 2016, and didn’t permanently achieve a 10% operating margin until the June ’23 quarter. (This is why AWS is so important and maintaining that margin is critical for Amazon.)
Amazon has been a top 10 holding for this blog for years, but as a portfolio manager, you’re always nervous over potential disruption, and Amazon’s AWS could be disrupted by AI. Probably not, but you have to stay alert to the possibility, hence watching the AWS margin and making sure it maintains it’s current levels is important.
My only disappointment with Amazon is that the retail giant had an Amazon Fresh store not 5 minutes from my home in the western suburbs of Chicago, and they just shut it down about a month ago. It was really a well kept store, the layout was very linear, sharp and clean, the employees were super-friendly, and while the foot traffic was slower, it looked like the store was being used for the growing expansion of Prime into grocery and perishables for Prime members. The “shoppers” i came across looked to be fulfillment specialists for Prime orders rather than ordinary grocery shoppers. Anyway, as a personal note, I was very sorry to see that store close.
Amazon is just up 2% YTD as of 10/24/25, versus the SP 500’s 15% YTD return, and you can see from the chart posted higher in the write-up that the stock has lagged greatly since mid-2021.
Valuation:
At $225 per share, AMZN is trading at 33x, expected 2025’s EPS growth of 22% and is expecting average EPS growth for ’25 to ’27 of 19%, so the stock is hardly expensive on a PE basis. The expected 4-year revenue growth rate from ’25 – ’28 is 11%. The retail giant is trading at 3.5x trialing twelve month (TTM revenue) primarily thanks to AWS, and usually trades around 20x cash-flow. Amazon could do a better job of generating a steady stream of free-cash-flow, usually sporadic at best. The capex investment in AI is not helping.
With $700 bl in revenue, maybe the expectation as an investor is that Amazon is becoming a consumer staple, i.e. higher valuation, and slower, but consistent operating income and EPS growth going forward. (I don’t think we are quite at the Coca-Cola stage yet, but investors have to think about it. )
Amazon and Walmart are on track to do $1.4 – $1.5 trillion in combined revenue in a $33 trillion economy.
How much “tech-like” growth is left in the ecommerce giant. AWS will let us know. (Here is the last Amazon-specific post, and it’s almost a year old.)
None of this is advice or a recommendation, but only an opinion. Past performance is no guarantee of future results. All EPS and revenue estimate data is sourced from LSEG. Readers should gauge their own comfort with market and individual security volatility, and adjust accordingly. None of this information may be updated, and if updated may not be done in a timely fashion.
Thanks for reading.