Here’s the coming week’s detail on US economic releases, per Briefing.com calendar:
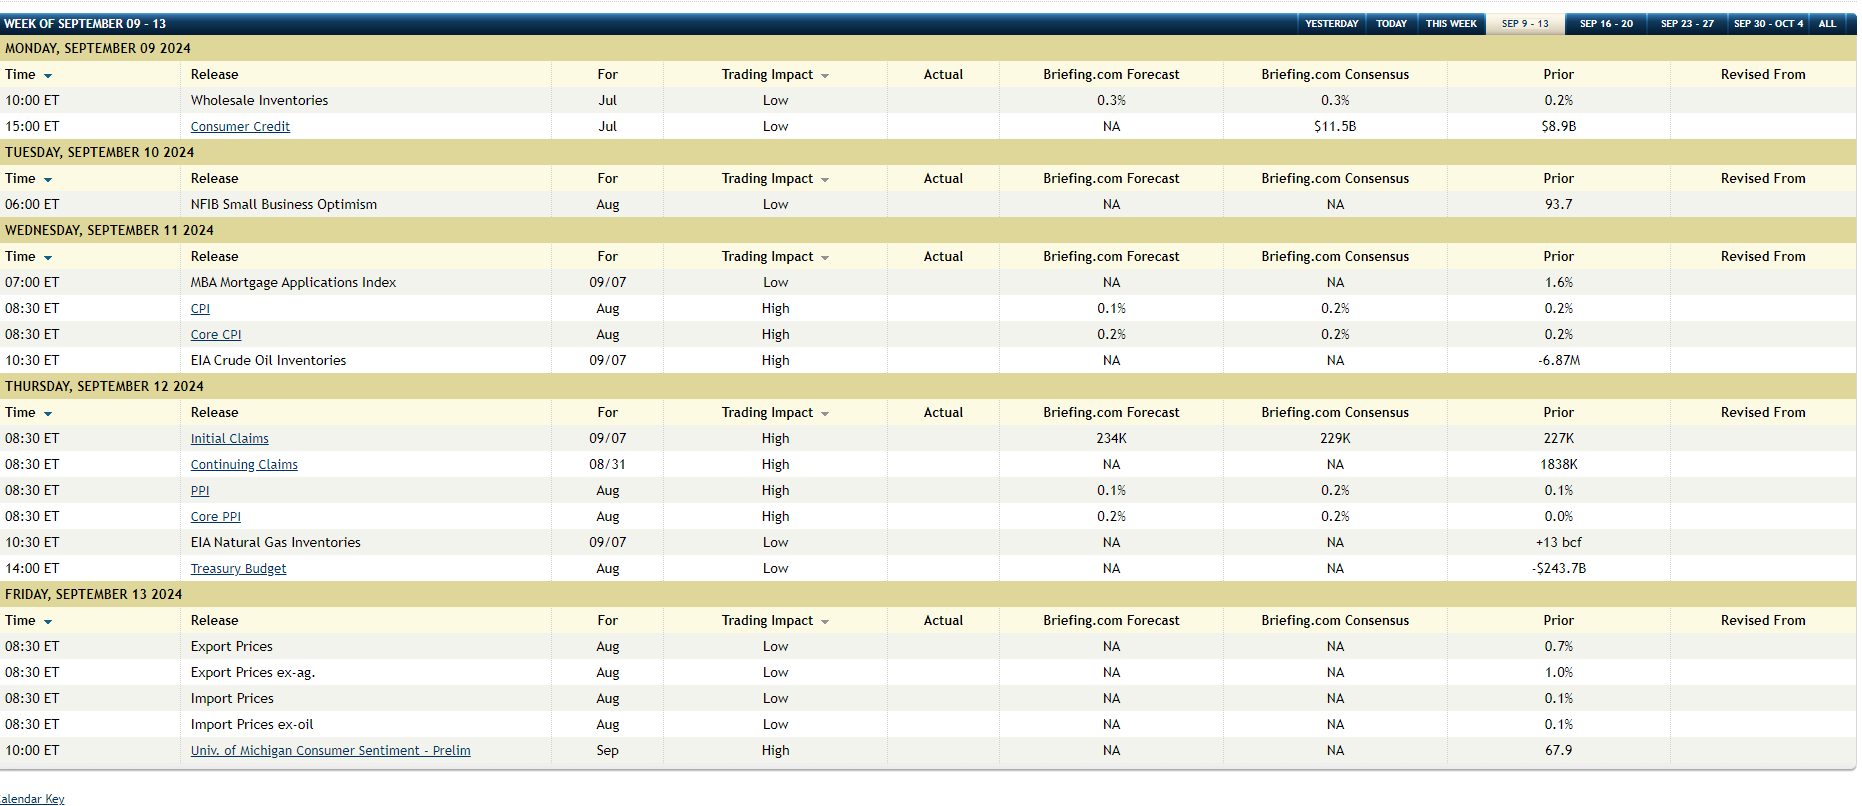
The August CPI report is due Wednesday, September 11th, 2024, before the opening bell. Investors are expecting +0.1% overall and +0.2% for Core CPI.
This release will only matter if actual CPI data is way off from what’s expected, since Jay Powell’s Jackson Hole Speech already noted that inflation worries are now transcended by the US job market and the ability to sustain job growth (particularly through the Presidential election).
Jay Powell’s and the FOMC’s worries about the US jobs market were perfectly-timed. The benchmark revisions were a big surprise as was last week’s JOLTS report.
There is clearly a slowing – or at the very least a softening in the rate of growth – going on in the US job market.
Corporate high yield credit:
This blog has written about high-yield and high-yield credit spreads several times over the last year. It’s a personal opinion but high yield credit spreads are the early-warning or “canary-in-the-coal-mine” for what might be an uncomfortable economic spell. (Early August ’24 references to high-yield credit are here and here. Here’s an early May ’24 referencing a Schwab Fixed-Income update from Kathy Jones (@KathyJones) Schwab’s bond guru, that noted the continued tightness of corporate high-yield OAS (option adjusted spreads)).
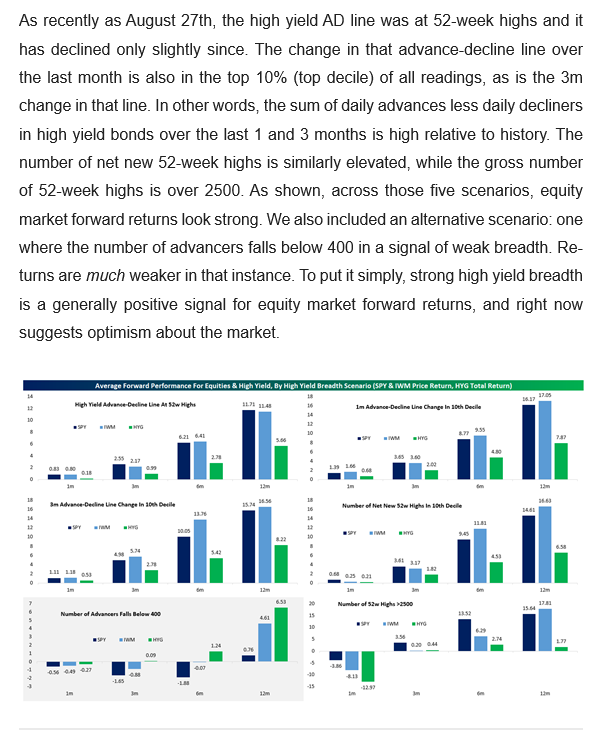
Bespoke put out a graphic this week in the Thursday, September 5th Closer, noting that corporate high-yield breadth continues to be positive. The unfortunate aspect to the September 5th, 2024 Bespoke Closer is that the attached bar charts are so small, they’d be virtually useless to try and attach here for www.fundamentalis.com readers to decipher.
Here’s one paragraph from Bespoke’s Closer cut-and-pasted with the bar charts, although readers are better off just reading and absorbing the commentary than trying to go blind reading the bar charts:
From the Bespoke Closer published September 6th, 2024:
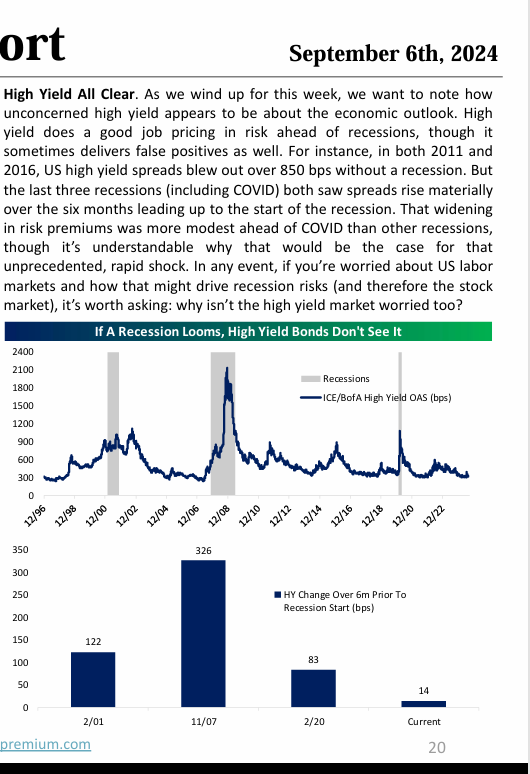
Please excuse the clipped page 20 of the latest Bespoke Report, I wanted readers to see the conclusion to the Bespoke analysis asking, “Why isn’t the high-yield credit market worried, too ?” showing a similar graph as Schwab’s Kathy Jones did in early May ’24.
The most recent update on high-yield and investment grade credit spreads:
![]()
Click on the above spreadsheet to expand it, and note the progression of high-yield and high-grade spreads (an average spread) since early April ’24. Note the last week in July and first week widening in high-yield, and how spreads have tightened in the last few weeks, but have not yet returned to the “slightly-over +300” level in early and mid-July.
As someone who grew up on the credit side of the business in the early 1990’s first starting out with municipal credit analysis and then assuming some corporate investment-grade and structured finance responsibility, the credit world reminds me of that old saying, “risk happens fast” and is more complex than you think. A lot of what happens within the corporate credit markets is aided or impeded by liquidity. Watching high-yield credit spreads widen in late 2007, and early 2008, thinking “an easier Fed will help tighten credit spreads as happened in the early and late 1990’s” (and clients were not long any high-yield credit at the time), and ultimately high yield credit spreads widened to a never-seen-before +25% over Treasuries. (That was a remarkable and completely unprecedented credit spread.)
What’s the point ? High yield credit spreads are NOT indicating deeper economic issues at this time, per the above research.
Paul Hickey and the Bespoke crowd have always done quality research work and it’s both good depth and wide in scope. (Usually you get one or the other from traditional Street research.) Bespoke was spun out from Laszlo Birinyi, who was a great market commentator, in the 1980’s and 1990’s. I remember as a credit analyst reading Birinyi’s work in 1994 when the Fed raised rates 6 times and the common Wall Street belief was that the secular bull market in equities that began in 1982 was now over. But only Birinyi and Bernie Schaeffer of Schaeffer’s Investment Research out of Cincinnati, came out and noted that 1994 was just a brief pause in the secular bull market, and well – the rest is history.
Corporate high-yield credit is very much an institutional market, i.e. mutual funds, large foundations, etc. so the fact that Bespoke is putting this work out to retail investors and small advisors is a plus.
Pay attention to high yield credit spreads: it’s another important tell in the investment game.
If credit spreads do widen sharply, it probably tells us that the US economy and US GDP growth is contracting faster than what was expected. About 6 months ago I asked a 30-year corporate bond manager what he thought credit defaults would max out if the US saw a recession, and he thought 4.5% to 5.5%. With current yields of over 7%, even if corporate high yield saw “worst-case defaults” in the next few fears, investors are still earning excess spread. If we ever did see 5%’ish default rates in high-yield, my guess is we would see rising yields and falling prices in the asset class, and yields on high-yield credit funds and ETF’s closer to 9% – 10%. Standard & Poors and Moody’s are the best places to get “expected” default rates for high yield, but as you can imagine they guard their proprietary models carefully.
No question, easier monetary policy i.e. a lower fed funds rate should help the corporate high-yield credit asset class, but it’s a trade-off between additional liquidity and what could be rising defaults.
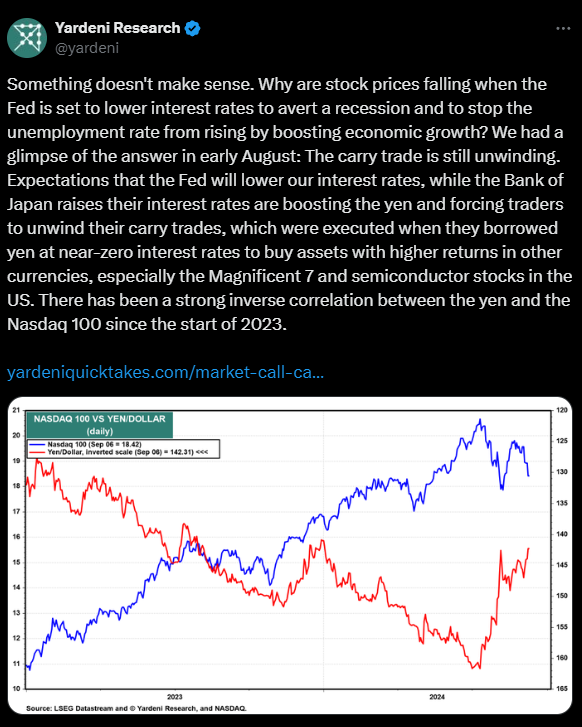
Ed Yardeni and the Yen Carry Trade:
There is probably more downside to the US equity market until the FOMC meeting to be held September 17th and 18th, 2024.
The above charts by Ed Yardeni, found on his website this weekend, noted the possible resurgence in the yen carry trade.
Ed makes a good case for the relationship between the yen and the Nasdaq 100. (I wonder what he’d think about the 4th consecutive week of forward SP 500 EPS increasing, relative to the resumption in the yen carry trade.)
Summary / conclusion:
Historically, September is the worst month of the year in terms of historical returns, so while many pundits ascribe current weakness to many reasons, just know it may (or may not) just be the seasonal trade that is behind the equity market softness.
Paul Hickey and Bespoke make a good case for corporate high yield not signaling deeper problems in the US economy.
The SP 500 forward EPS estimates increasing for the 4th week in a row, can’t be ignored.
A reader asked me about yesterday’s blog post and how the forward 4-quarter estimate didn’t start to roll over until the week of July 20th, 2008. That’s the exact right question to ask. 2008 was a truly exceptional event in US economic history for the capital markets and the US housing market. It was the furthest thing from a “normal” recession.
My own opinion is that SP 500 forward estimates capture relatively normal economic events, and probably do a poor job of capturing the abnormal or highly unusual events that impact the US economy (i.e. covid, 2008, 9/11, etc.). In fact when economic conditions have been rather stable – as has been the case since late 2022 – EPS forecasts probably have a higher degree of accuracy for those sectors most closely tied to the economic cycle.
The worst aspect of managing money is having to listen to the ridiculous amount of predictions, and forecasts, when in fact the best tell is price itself.
None of this is a advice or recommendation, but only an opinion. Past performance is no guarantee of future results. All SP 500 EPS data referenced in the article is sourced from LSEG. Investing can and does involve the loss of principal, even for short periods of time.
Thanks for reading.