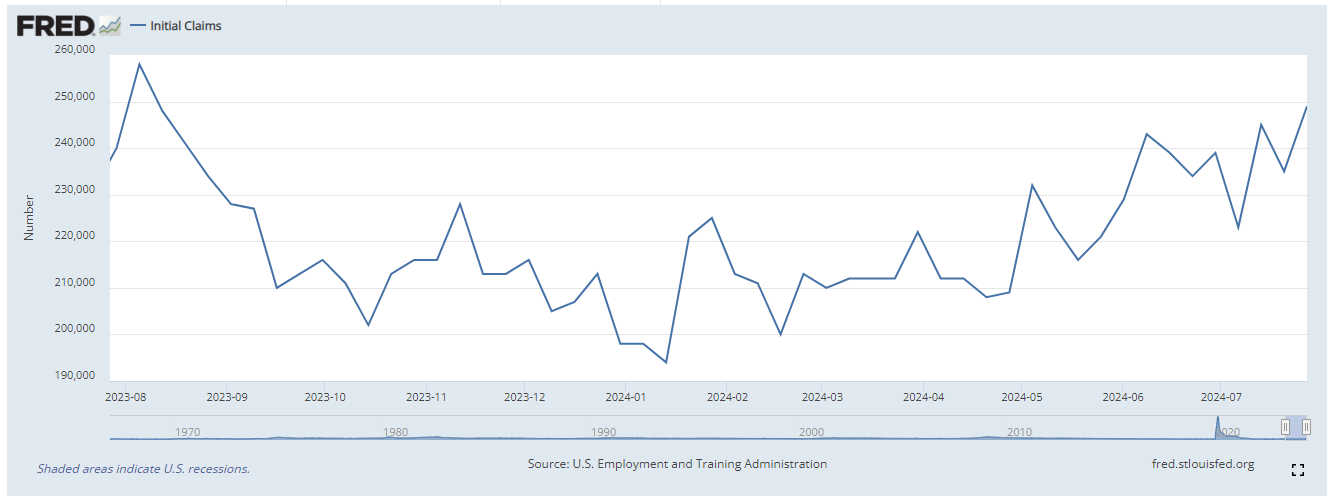
While I thought last week’s jobless claims number of +255,000 was the highest print in the last year (and was a good tell into the next morning’s July ’24 jobs report), in fact Rick Santelli noted that +258,000 was the highest print of the last year, and you can see it on the above graph from FRED, the Federal Reserve Economic Database.
Personally, I’ve always liked the jobless claims data release because the data is frequent, (every Thursday morning at 7:30 am central) and timely, (as of Friday of the prior week), so even though we saw the July ’24 payroll number and household data, last Friday, August 2nd, (the nonfarm payroll jobs report is only measured from the first 10 days of the month), so tomorrow morning’s jobless claims data will give us current data as of the end of July ’24.
Personally, I’ve always thought it was the perfect economic data point print for the above reasons, but most economists seem to brush it off.
Last weekend’s SP 500 earnings update talked about the importance of keeping an eye on credit spreads – even for equity investors – given credit spreads (in my opinion) are the “canary in the coal mine” for deeper market issues, I wanted to update readers on what’s happened to high-yield (below investment-grade) credit spreads this week, as of this morning’s data:
- Friday, August 2nd: +325, up from +308 the prior Friday;
- Monday, August 5th: +325, up from +308 the prior week;
- Tuesday, August 6th: +372, up from +313 the prior week;
- Wednesday, August 7th: +393, up from +320 the prior week;
These numbers are sourced from Bespoke’s Morning Lineup, and my guess is since Paul Hickey and the kids stuck up a graph of high-yield spreads widening in the Weekly Bespoke Report published Friday night, August 2nd, that the data above has a little bit of a lag to it. (It’s always best to watch credit spreads by sector, but since individual high-yield bonds are not bought for clients, instead ETF’s and mutual funds are used (and more ETF’s than mutual funds), I use the Bespoke spread data as a broad gauge for credit spreads.
The last time that high-yield credit spread average was over 400 (recently), was the week of November 11 ’23 when the spread hit +408.
That was 9 months ago.
The point is another metric to keep an eye that is reflective of “fear” vs “greed”.
Summary / conclusion: This blog has always worked with a pretty good technician – Gary Morrow found over at X – (X @garysmorrow), and thinks the gap down on the major equity equity indices on Monday morning will remain heavy, and that the various bond market asset classes may not trade back to the Monday morning, August 5th high prices (Like Treasuries, muni’s, high-grade corporate) for a while.
The ISM Services number really caught a lot of people off-guard Monday morning, as it came in at 51, it’s first print over 50 in 5 readings, which means that the services sector is still pretty healthy.
Services is 85% of the private sector GDP.
Personally, I think we’re in for a choppy eight weeks until the October ’24 year-end rally starts.
Expect interest rates to rise a little, expect the data to show the US economy isn’t falling off a cliff, and stock prices could meander for 8 weeks. In terms of SP 500 earnings, the “upside EPS surprise” is just half of what it was last quarter, meaning that SP 500 earnings are a little less robust than the prior 5 – 6 quarters.
This could all change tomorrow, too, so don’t forget that.
None of this is advice or a recommendation, but only an opinion. Past performance is no guarantee of futures results. Investing can involve the loss of principal, even for short periods of time.
Thanks for reading.