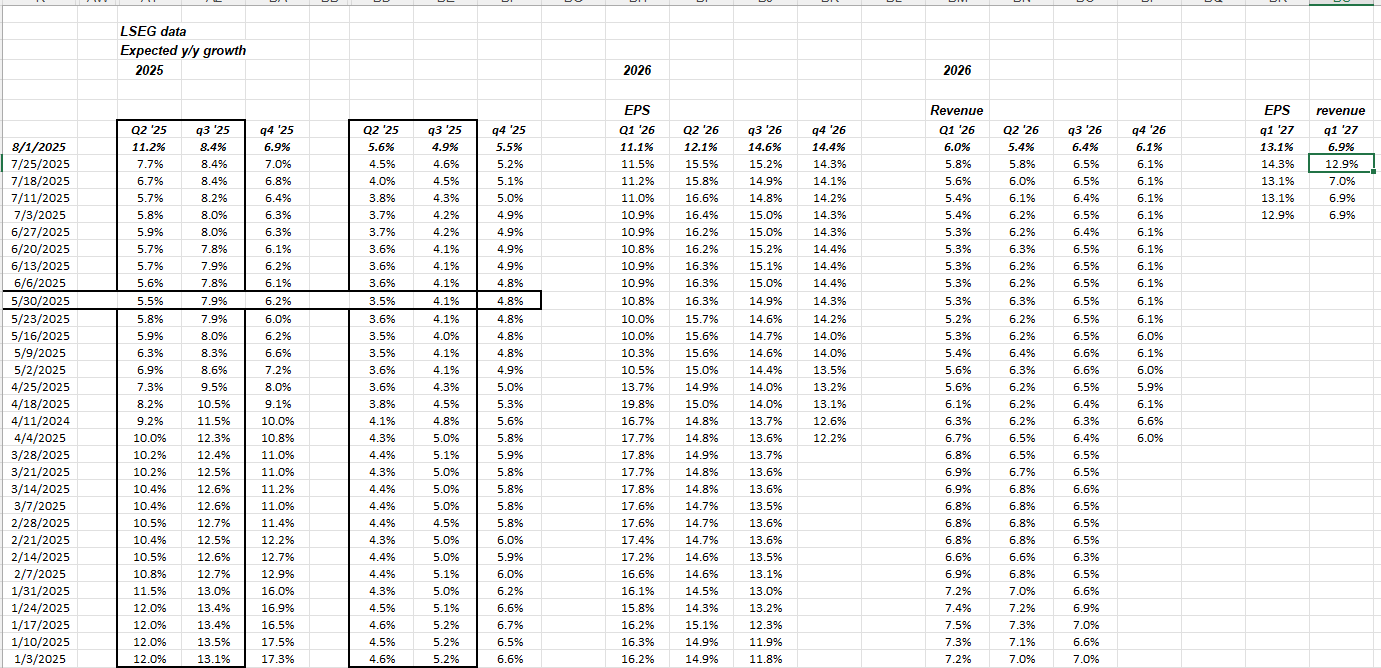
Continuing with a table shown to readers over the last few weeks and months, here’s the SP 500 quarterly, “expected” EPS and revenue growth rates for both the current Q2 ’25 results being reported and for Q3 ’25 and beyond as well.
With the Mag 7 – 10 now reported, Q2 ’25 expected EPS and revenue growth rate revisions have been increased smartly, but so also have Q3 ’25 and Q4 ’25 expected growth rates, which as was written about in this post in the last few weeks:
Data source: LSEG
Remember, the key takeaway from this post is that “normally” as Q2 is being reported, the typical pattern for Q3 and Q4, is to see lower revisions of expected growth rates, but in fact, both Q3 ’25 and Q4 ’25 growth rates are being revised higher, which bodes well from a probability perspective for seeing higher-than-expected EPS and revenue growth rates in those quarters.
Does that mean readers will see higher SP 500 prices when Q3 ’25 and Q4 ’25 results are reported ? Not always, but as the famous old saying goes, “The fastest man doesn’t always win the race, but it’s not a bad way to bet”.
How have the SP 500 full-year 2025 and 2026 expected sector EPS growth rates changed ?
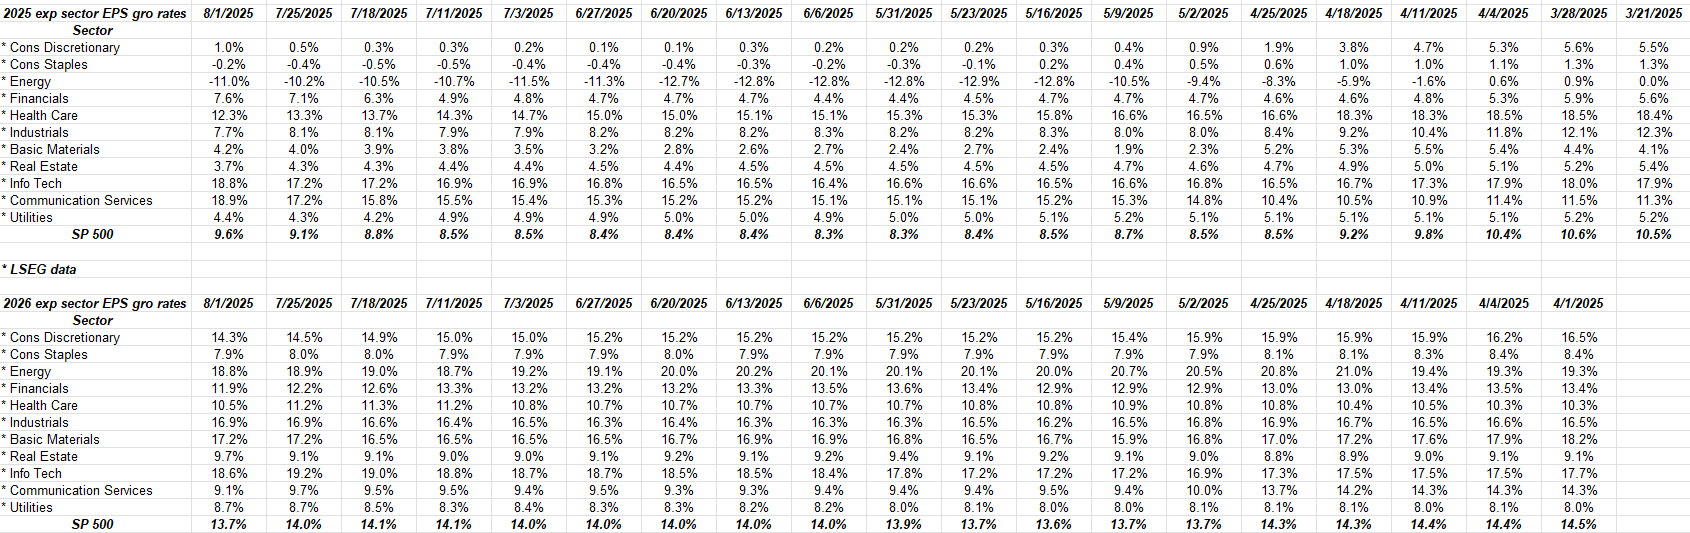
2025 estimated EPS growth rates by sector have started to be revised higher after the lows in early July ’25, while the expected 2026 EPS growth have been fairly steady, looking back to early March ’25.
It’s still surprising to see the healthcare sectors expected low double-digit growth rates for 2025 and 2026, and the sector trading flat on it’s back this year. I think it was Ned Davis Research that noted that healthcare is the only one of the 11 SP 500 sectors trading below it’s 200-week moving average.
One last look at Q2 ’25 EPS and revenue results from a different angle:
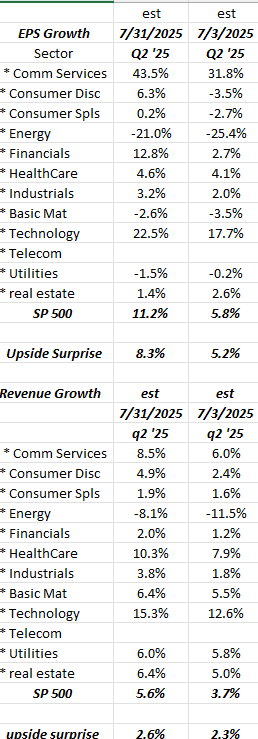
This shows the progression of sector EPS and revenue growth (y-o-y) and how it changed over the last 30 days. Note the EPS growth improvement for Communication Services (top of s/sheet) from July 1 to July 31. That’s META, Alphabet and Netflix.
Note the upside surprise for SP 500 EPS – that’s a 310 basis point improvement from July 1 to July 31, ’25.
Note too the change in revenue growth (bottom half of detail). Every sector is reporting higher revenue growth with Q2 ’25 financial results.
SP 500’s forward 4-quarter estimate:
A reader asked about the the lack of discussion around the ” SP 500 forward 4-quarter estimate” so here is a quick update for regular readers:
- 8/1/25: $281.15
- 7/25/25: $281.37
- 7/18/25: $280.83
- 7/11/25: $280.60
- 7/3/25: $279.92
Conclusion / summary:
333 of the SP 500 components have now reported financial results for Q2 ’25. The unofficial end of Q2 ’25 reporting will happen when Walmart reports in a few weeks, but the results and the positive revisions bode well for Q3 and Q4 ’25 results as it stands today. What happens with the stock market in the seasonally-weak period of August and September is a guess.
LSEG (formerly Refinitiv, which was formerly FirstCall), is the source of all this data, and it’s been tracked on this blog for years. A lot of times the data doesn’t really tell us much, but when the data starts to deviate from predictable patterns, like Q3 and Q4 ’25 have started to do, then you sit up and take notice.
None of this is advice or a recommendation but only an opinion. Past performance is no guarantee of future results. Capital markets can change quickly for both the better and worse, so readers should gauge their own comfort with portfolio volatility and adjust accordingly. None of the information above may be updated, and if updated, may not be done in a timely fashion.
Thanks for reading.