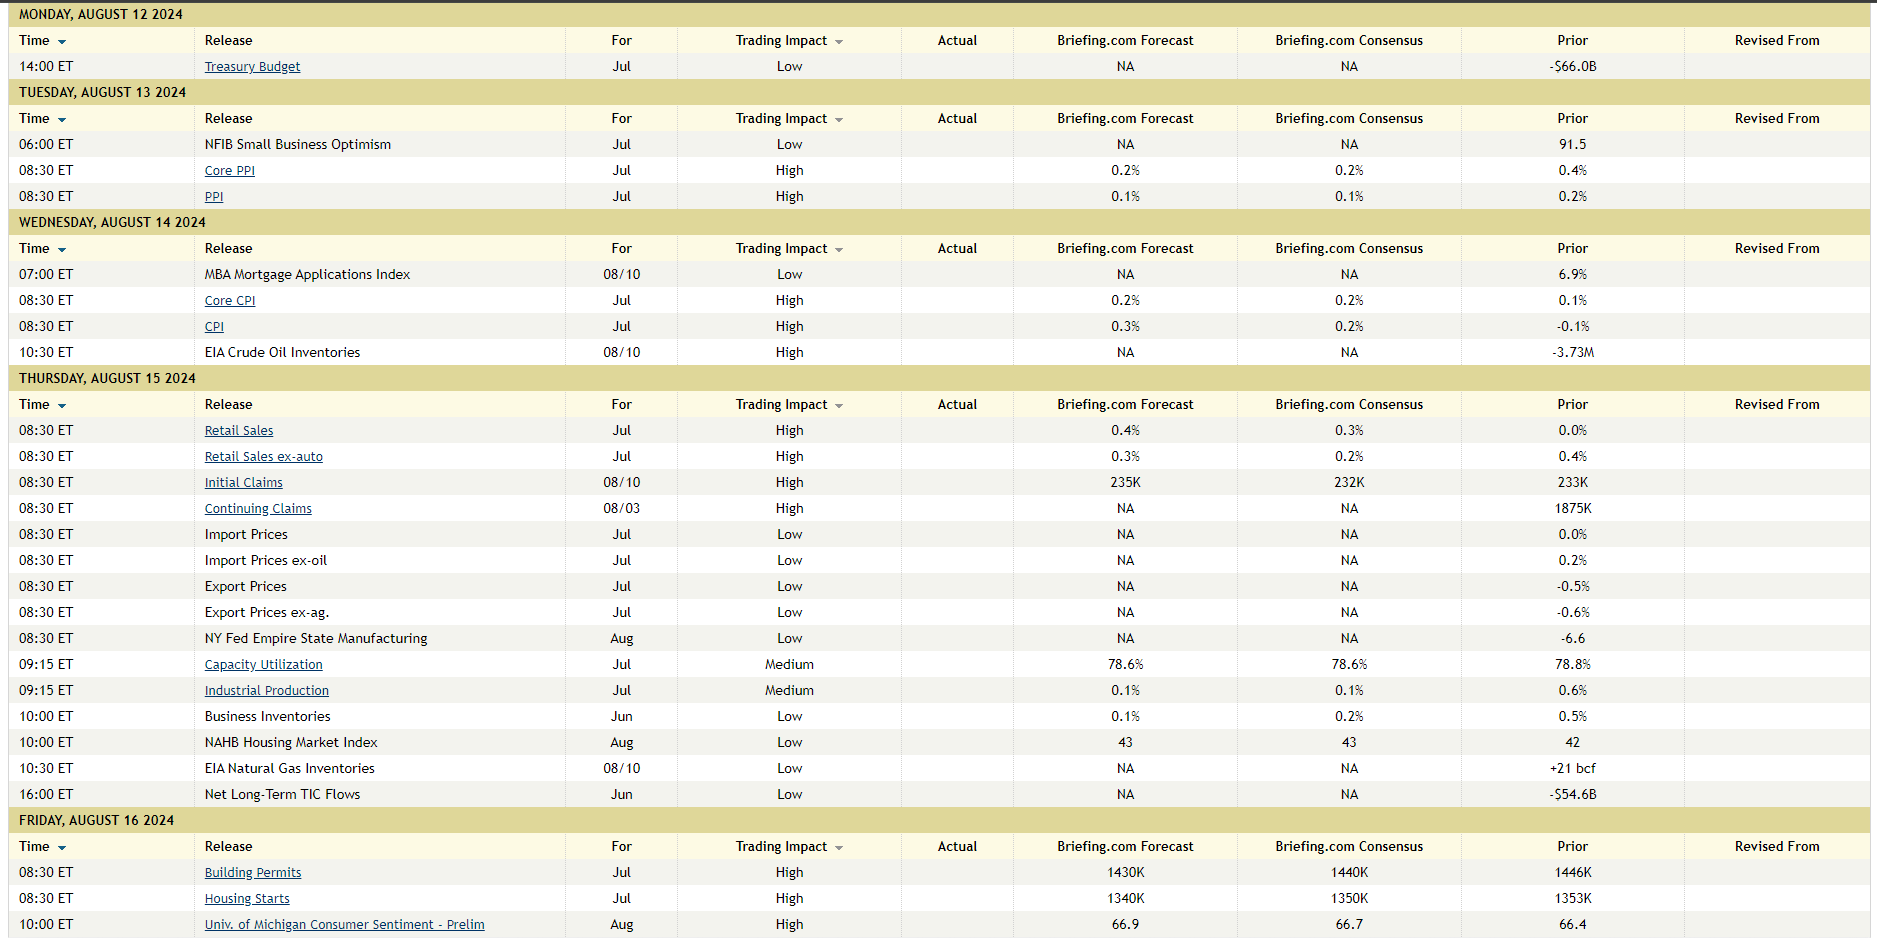
The big economic print this week will be Wednesday’s July CPI and Core CPI, which along with Thursday’s July Retail Sales data, will be closely scrutinized by the mainstream financial media.
Here’s Briefing.com’s economic calendar:
While Tuesday’s PPI print will get a little attention, the data point just has never had the gravitas that CPI has, which in my opinion, is tied to the fact that PPI is more representative of the US economy between 1945 and 1980, i.e. manufacturing, industrial and producer-related. In the early 1990’s as a fixed-income analyst with a mutual fund firm, my boss, who was Director of Research and built the firm’s valuation models, used to share with us the PPI (and other economic) data in analyst meetings. While the early-stage and intermediate goods inflation would look daunting and scary, it was remarkable how – by the final stage PPI print – the PPI early-stage inflation would simply disappear. This was during the first banking crisis that plagued the Bush Administration (Bush 41), that lasted from 1988 through 1993, when Greenspan was reducing the fed funds rate from 7% in the late 1980’s to 3% by late 1993. (The only guys that would remember this today are Jim Chanos or Jim Cramer, who’ve been around since the mid-1980’s, neither of whom read this blog.) If as a reader, you are at all curious, here’s how the PPI differs from the CPI, per the Bureau of Labor Statistics.
The point is the PPI matters, just not as much as it did 40 – 50 years ago.
Wednesday’s July CPI and really July’s Core CPI print will likely generate the biggest market reaction (if any) on Wednesday, August 14th. I thought Paul Hickey and the Bespoke crew had the best take on the expected data points in their Bespoke Report published Friday night, August 9th, so rather than listen to my opinions, here’s Bespoke’s analysis and conclusion:
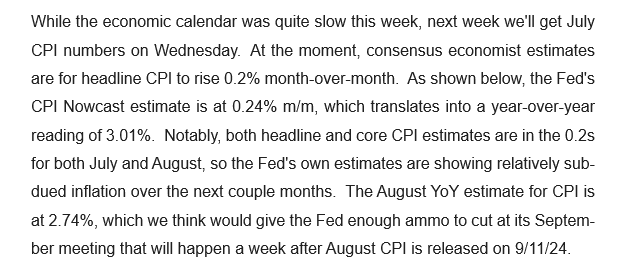
The general consensus is that Core CPI and Core PCE (July PCE due out August 30th ’24) will continue to decline.
A 3.94% 10-year Treasury yield doesn’t give investors much of a “real (i.e. inflation-adjusted) return today, without fed funds rate reductions.
——————
Walmart reports their fiscal Q2 ’25 earnings on Thursday morning, August 15th, 2024. What’s interesting is the same morning, July Retail Sales will get reported, and Walmart, with a $703 billion revenue estimate in fiscal 2026, remains a big part of retail spend in America.
This blog will have a separate earnings preview for Walmart this week. Walmart is an AI story, as well as a burgeoning e-commerce story as much as a US consumer spend story, so don’t be lured in by the mainstream financial media.
More to come on this topic, but in a separate post.
———————
SP 500 earnings data:
- The forward 4-quarter estimate ended this week at $258.77, down from it’s early July ’24 peak of $261.39 and down from last week’s $259.51;
- The PE on the forward estimate is 20.6x vs the 20.5x from last week, and the 21.6x as of June 30 ’24.
- The SP 500 earnings yield ended the week at 4.84% vs 4.87% last week. I’d like to see the SP 500 earnings yield get above 5%.
- The SP 500’s EPS upside surprise at +4.5% as the unofficial end of Q2 ’24’s earnings season approaches; this is about half the “upside surprise” of prior quarter’s, back through ’23.
The 6-week update SP 500 earnings update will next weekend after the end of Q2 ’24 earnings season, but the upward EPS revisions to the SP 500 that we saw in May – June ’24 and that were clearly a break of the typical SP 500 pattern have ended, and the SP 500 forward earnings estimates have clearly returned to historical patterns.
Here’s a little preview:
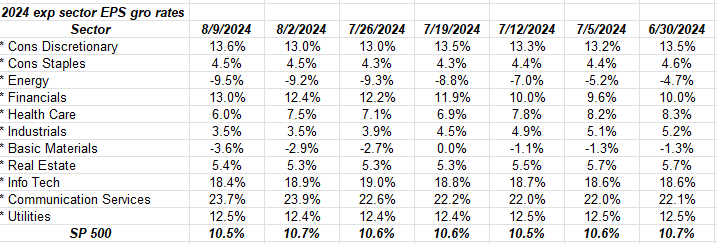
The sector’s that are showing faster expected EPS growth rates for full-year 2024 after Q2 ’24 earnings are financials, (that was a nice pop in expected EPS growth in July ’24) and communications services (heavily influenced by META and GOOGL).
Technology, which is the only sector most people care about, since it’s market cap is 30.6% of the SP 500’s market cap is expecting 18.4% EPS growth in the calendar year, versus +18.6% on June 30, and +16% to start the year.
That’s probably what’s missing in the mainstream financial media’s “analysis” (and I’m being generous with that term) of tech earnings today: there isn’t a lot of downward pressure on EPS estimates (with the possible exception of Intel among the companies I follow), there just isn’t a lot of upward pressure either, meaning analysts are not really revising EPS and revenue estimates higher just yet. Within tech there is probably some uncertainty on the part of sell-side analysts as they see this massive “capex” growth y-o-y, which doesn’t yet translate into EPS growth.
And the tech sector’s revenue growth for Q2 ’24, which is currently expected at +10.5%, is currently expected at +11% for Q3 ’24.
This topic is worthy of it’s own blog post, but it would be heavily data laden, and not an easy read.
More to come on this topic, this week or next weekend.
Don’t forget about inflation expectations:
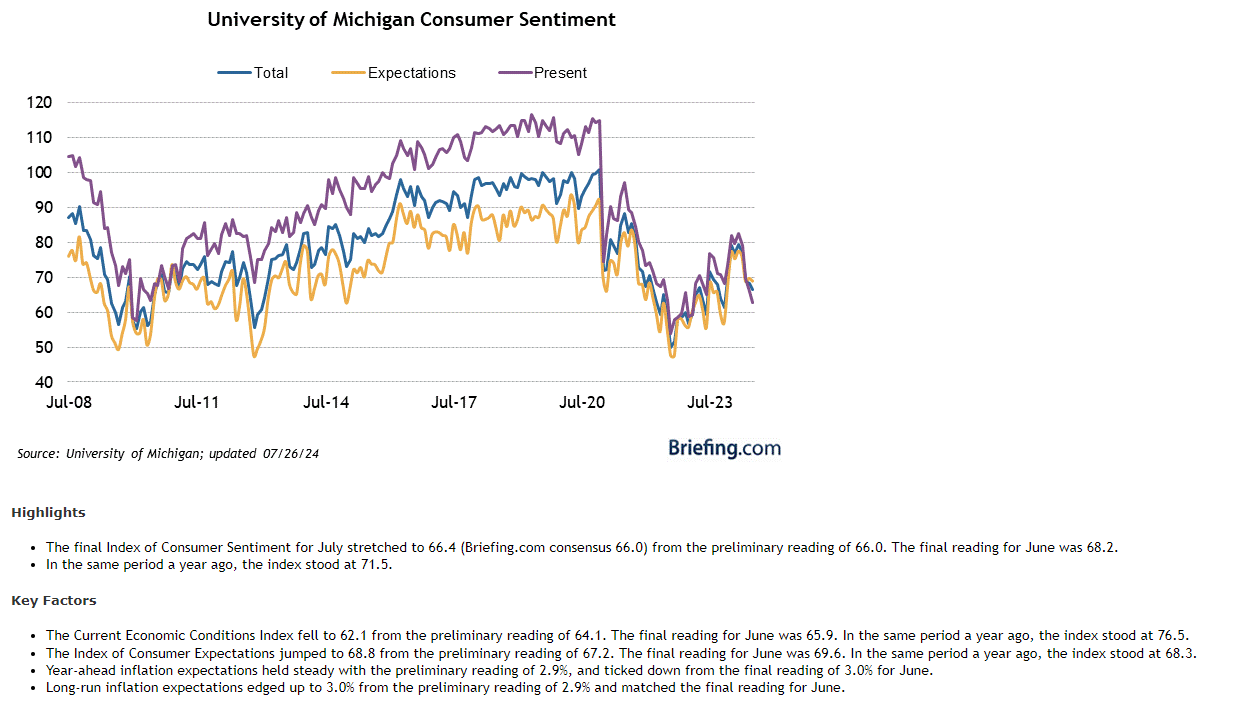
Rather than actual inflation prints, which the mainstream financial media makes a big deal of, where the rubber meets the road in terms of inflation data has always been “inflation expectations” which every econ, money and banking and bond management text book will tell you.
The Michigan Consumer Sentiment measure which gets reported Friday morning, August 16th, will have an update on “inflation expectations” (look at the last two bullet points of the above chart cut-and-pasted from Briefing.com). Look at the chart itself too, both inflation and inflation expectations are coming down, and the fact they aren’t crashing is probably good for the US economy and the US stock market, ala 2007 and 2008.
Summary / conclusion:
Weekly SP 500 returns:
- 8/9/24: -0.04% (pretty remarkable, after the SP 500 opened down -3.5% Monday morning, 8/5/24)
- 8/2/24: -2.06%;
- 7/26/24: -0.86%;
- 7/19/24: -1.79;
It’s been 4 consecutive weeks since the SP 500 hit it’s all-time-high. Monday morning’s open on the back of drop of Japan’s Nikkei has led to the SP 500 becoming oversold on a sentiment basis, even though very little actual price damage has been done to the SP 500, which is a “correction phase” I’d love all clients to experience.
So far anyway, this is a needed market correction to correct an overbought situation amongst large-cap and mega-cap tech stocks.
None of the above is investment advice or recommendation, but only an opinion. Past performance is no guarantee or suggestion of future results. Investing can involve loss of principal for even short periods of time. All SP 500 EPS and revenue data are sourced from LSEG.com.
Thanks for reading.