First, a couple of good charts from Morningstar the last few days on market attribution, as well as a style-box update:
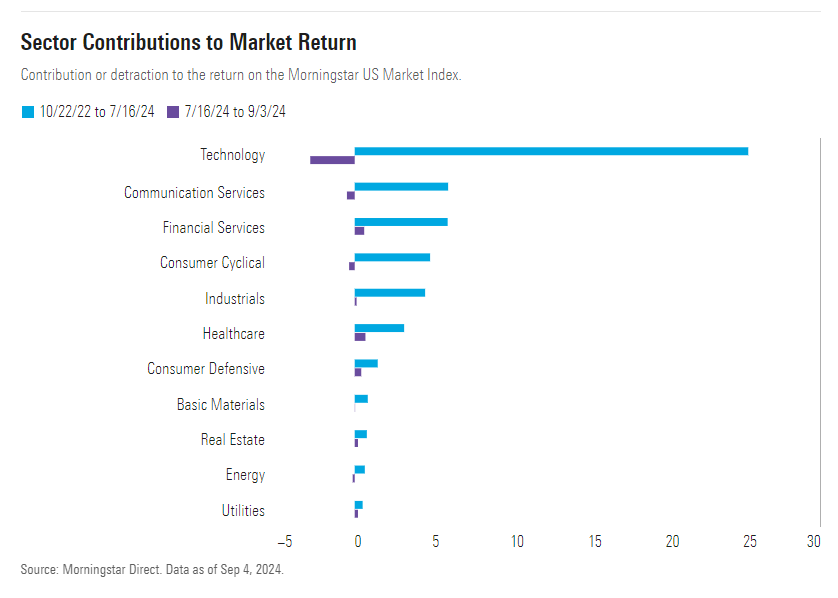
No surprise that since the bear market bottom in October, 2022, the tech sector has been the performance leader. Financial services in 3rd place surprised me, given it’s “value” bias, but we’ll take it.
No doubt JP Morgan (JPM) has helped financial services. The stock is the #1 financial in the SP 500 in terms of market cap weight, and currently the 11th largest stock in the SP 500. JP Morgan has returned 53.5% (annual return) since 10/22, as of August 31 ’24, versus the SP 500’s +28.75% for the same time period.
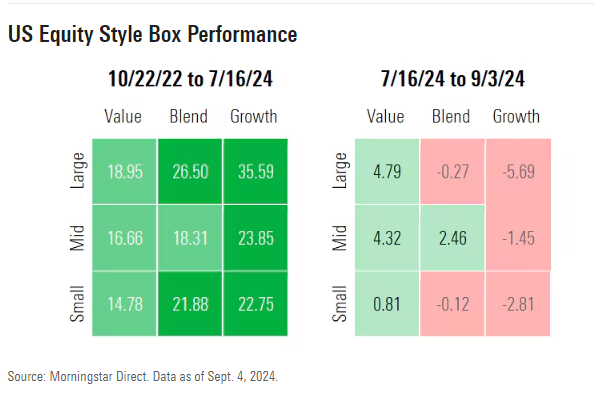
Market corrections often see a complete reversal of what’s working, and what’s not. Tech and growth are now out of favor, while value is in favor.
Again, none of this is probably a big surprise to readers.
SP 500 data:
- The forward 4-quarter SP 500 estimate rose this week – for the 4th week in a row – to $260.60 versus last weeks $259.74.
- The PE on the forward estimate is no2 20.75x versus last weeks 21.75x;
- The SP 500 earnings yield jumped to 4.82% last week versus last weeks 4.60%;
- The SP 500 EPS and revenue “upside surprise” hasn’t changed since the Q2 ’24 earnings season unofficially ended. EPS upside surprise in Q2 ’24 is still +4.6%, while the commensurate revenue upside surprise is +1.1%. The EPS upside surprise is about the half the rate of the previous 5 quarters.
Here’s what was a mild surprise when compiling the “weekly update”:
The technology sector’s expected growth rates for 2024 and 2025 continue to rise (albeit at a slower rate):
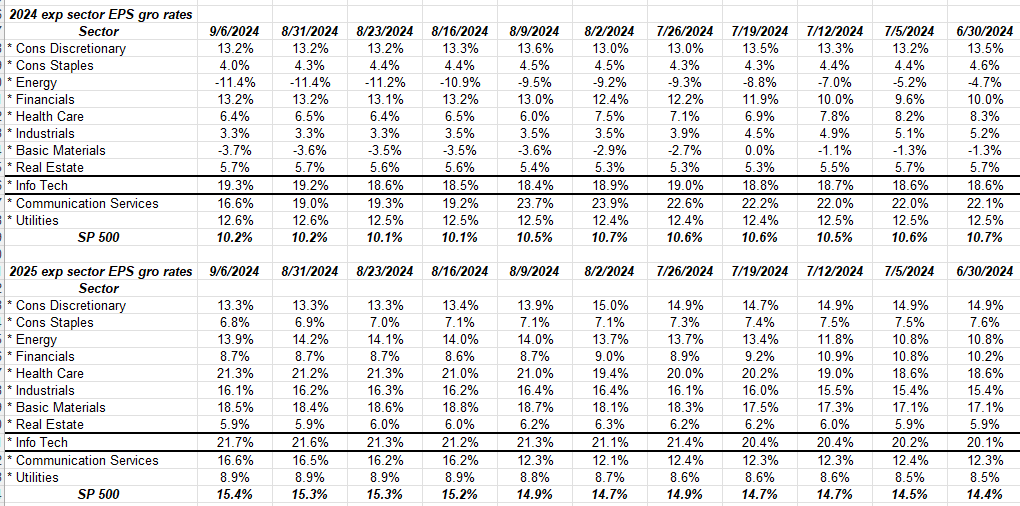
Apple has the largest earnings weight within the tech sector, so Apple can influence tech EPS.
There doesn’t seem to be any issue with Apple’s EPS estimate revisions that would indicate a problem with the stock:
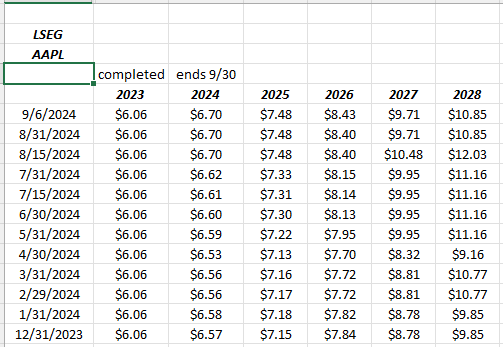
The new iPhone launch expected this coming week, per the above number and positive revisions for fiscal ’25 and fiscal ’26, portends another successful iPhone progression.
SP 500 rate-of-change:
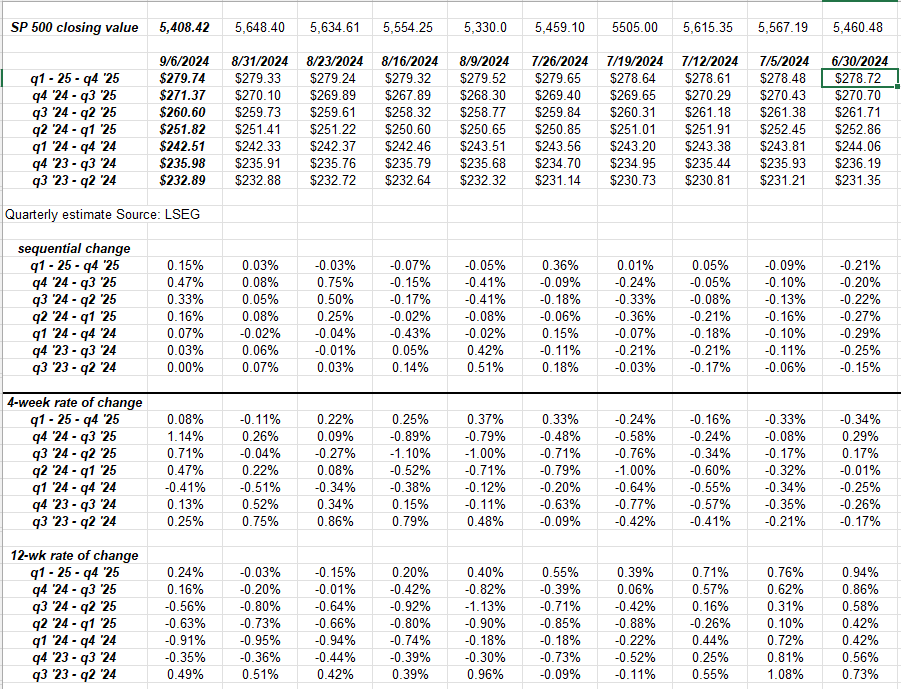
This table shows the rate-of-change for the forward 4-quarter EPS over time.
After a round of weakness (lower revisions to forward EPS) beginning mid-July ’24 and then up until mid-August 24, the forward EPS estimates have now sequentially increased 4 weeks in a row, pulling the 4-week rate of change higher, but still showing a little weakness in the 12-week rate of change.
Shown another way:
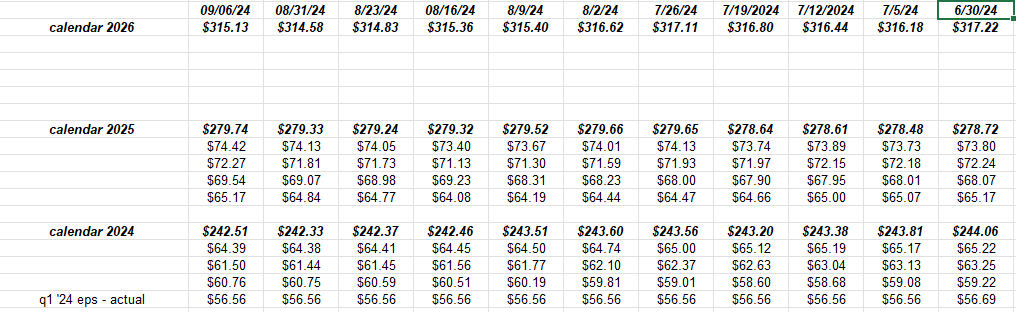
The 2024 calendar EPS estimate is a little lower than where it was at the end of June ’24, but the 2025 calendar EPS estimate is a little higher.
Summary / conclusion:
Weekly returns:
- SP 500: -4.22%
- Nasdaq Comp: -5.76%
- Nasdaq 100: -5.86%
- SP 500 MidCap (MDY): -4.84%
- SP 500 SmallCap IWM): -5.53%
- SP 500 equal-weight (RSP): -3.08%
Return source: Ycharts
Don’t shoot the messenger. This wasn’t a great week for equity market returns.
Either the stock market(s) will start to recognize that SP 500 earnings aren’t falling, OR forward estimates will start to roll over as the market heads lower.
SeekingAlpha has been kind enough to pick up this blog over the years, and I can already tell some of their readers (maybe contributors) are circling the long-only investors like myself and touting the bear case. That’s ok – as long as it doesn’t get obnoxious.
In terms of “SP 500 estimates vs the market action” and for readers interested in a comparison period, in 2008, the ” SP 500 forward 4-quarter estimate” didn’t peak until July 20th or so, and then was revised lower every week, until Lehman Bros bankruptcy took it right off a cliff. But readers should remember, the SP 500 peaked in late October, 2007, after the SP 500 tested it’s March, 2000, high of 1,550 (and in October, 2007 the SP 500 actually traded through above the March, 2000, to 1,575 or so before rolling over), so the SP 500 functioned appropriately as the “discounting mechanism” we all know it as, and peaked before the estimates did.
Could the same thing be happening today ? Absolutely.
Oracle reports Monday night, September 9th, after the close, and Safra Katz and has really done a great job with capturing as much of AI as they can. This blog has modeled the stock since the late 1990’s and I felt like they really were unprepared for the cloud explosion in the first part of the last decade i.e. 2010 to 2015, but are driving margin expansion once again. Any time Oracle has seen their operating margin between 47% – 51% it’s usually meant a peak for the stock (usually for 3 -6 quarters) and last quarter’s (May ’24 fiscal Q4) saw a 47.5% operating margin for the former database giant. Oracle will give us some additional insight into the AI explosion Monday night. Let’s see what they have to say.
Additional AI insight will be gleaned from Micron Technology (MU), which is scheduled to report Wednesday, September 25th, 2024 after the market close. Micron has seen a sharp recovery in memory prices mainly due to (and I’m not an expert in either AI or the memory business, but simply follow the revenue and EPS estimates) the increased demand for memory to support the Nvidia GPU’s.
More so than Oracle, Micron will give readers and investors good insight into the AI progression.
The SP 500 isn’t yet oversold but another week like last week and it should get there. It’s been a wild ride since late July ’24 and the “yen carry trade” of August 2nd through August 5th.
More blog posts to come over the weekend.
None of this is advice or a recommendation, but only an opinion. Past performance is no guarantee of future results. All the SP 500 estimate data is sourced from LSEG. Investing can and does involve the loss of principal even for short periods of time. Readers should gauge their own comfort with portfolio volatility and adjust portfolio accordingly.
Thanks for reading.