What spooked the Treasury market on Wednesday, September 6th, 2023, when the 10-year Treasury yield traded up to 4.30% once again ?
Well the August ’23 Services PMI report sure didn’t help, which was released on Wednesday morning, September 6th.
Here’s the summary of the details of the August ’23 Services PMI report from yesterday: (summary courtesy of Briefing.com):
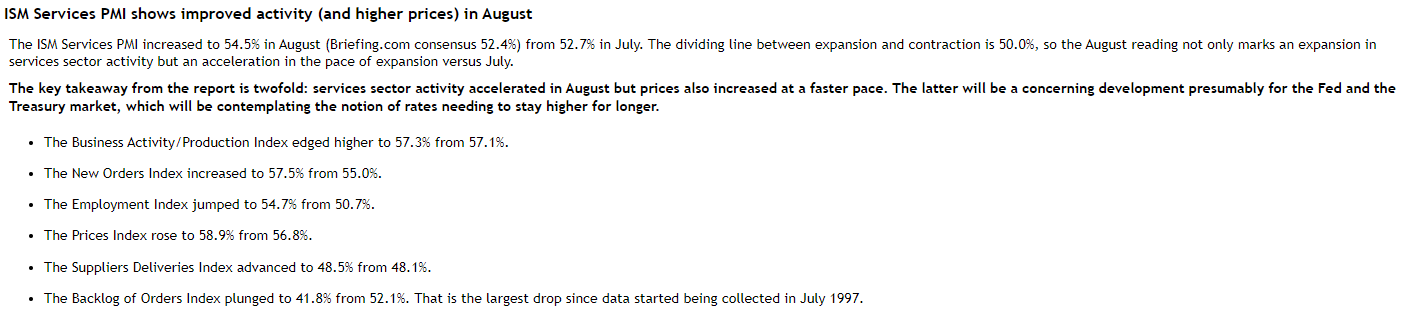
The jump in the Services PMI employment index got a lot of chatter from the financial media yesterday, with many concluding the data is at odds with last week’s nonfarm payroll report, but the jobless claims this morning of 216k versus the expected 233k (briefing.com consensus) again supports the bond market nervousness.
Revisiting last week’s PCE data:
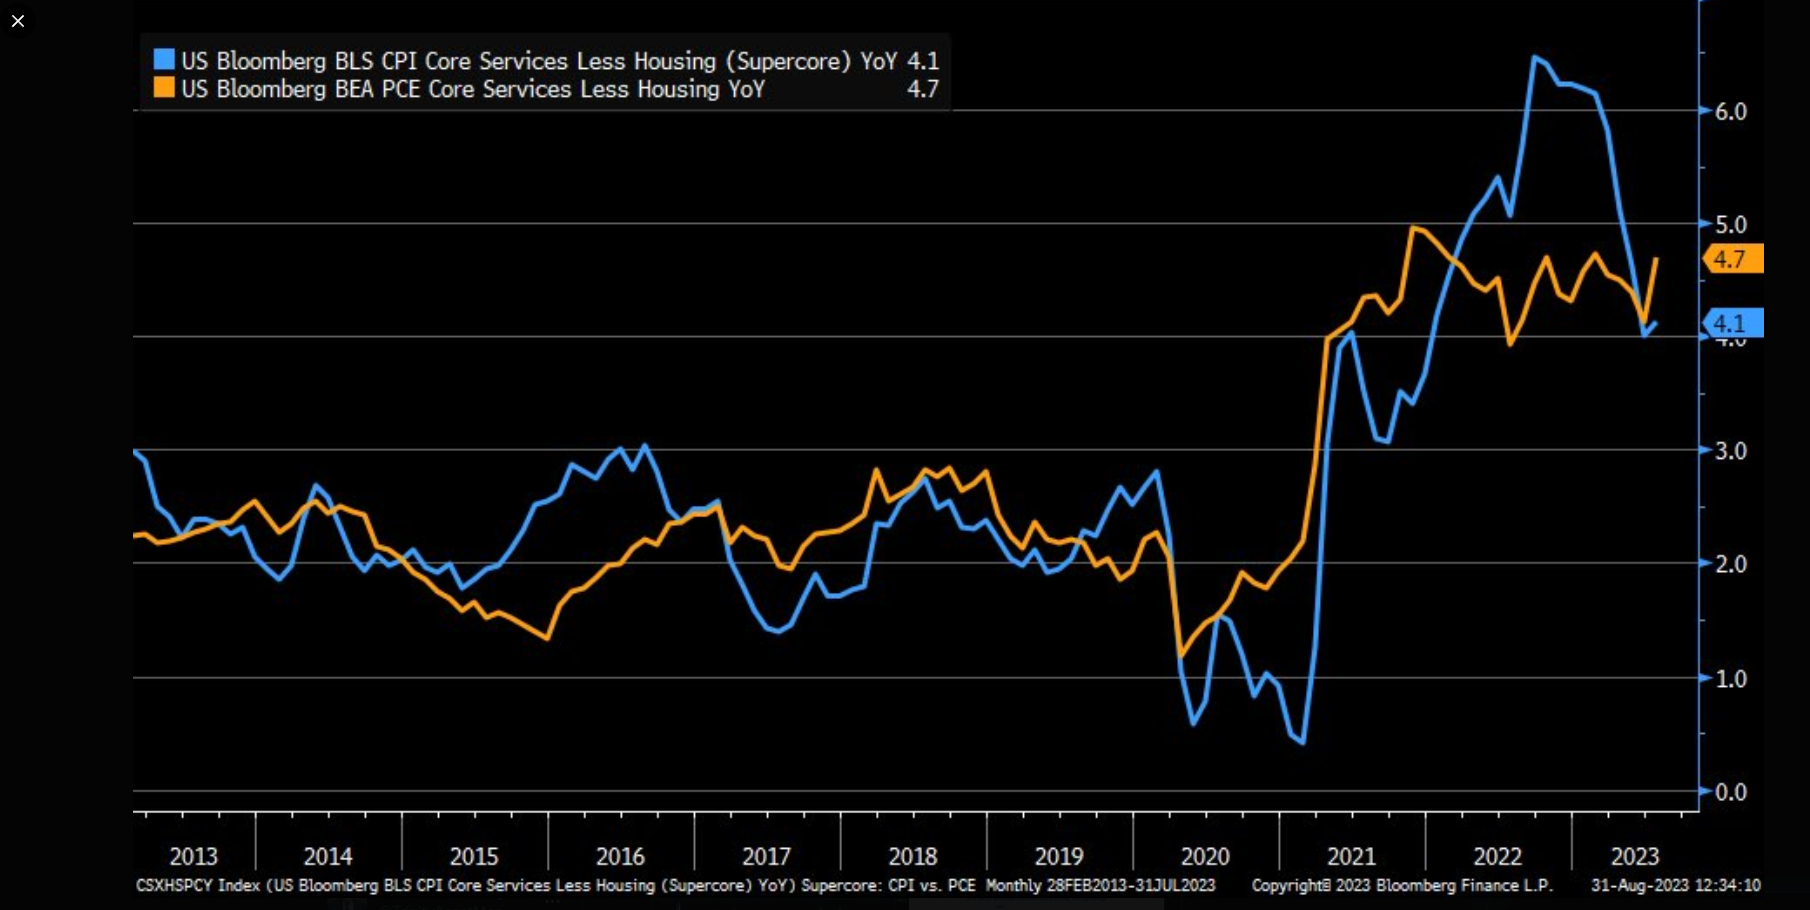
Here’s a chart posted on X (formerly Twitter) by LizAnn Sonders, Schwab’s strategist on the PCE data from last week (8/31/23) which shows Core PCE services ex-housing – a metric cited many times by Jerome Powell as something being watched by the Fed / FOMC – showing an uptick in July ’23.
The impact of the Core PCE data was lost last week thanks to the positive action in Treasuries after the weak Jolts report, and the August ’23 jobs data on Friday September 1.
Summary / conclusion: There is still a lot of nervousness around that 10-year Treasury yield and it approaching 4.35% once again. The October ’22 high for the 10-year Treasury yield was 4.33% according to one of the technician’s Trinity uses for this kind of work, and we keep bumping against this level.
Personally, I put a lot of weight on jobless claims because this release is frequent (every Thursday morning) and timely in its use (the data is updated as of the Friday of the prior week) so I think it is very useful as an economic indicator, much more so than many others, like the monthly jobs report, which is actually two surveys – household and business – and subject to large revisions up to two months after the fact.
- The TLT low last October ’22 was $91.85;
- The AGG 52-week low is $93.20;
Those are the two levels being monitored for positions within client accounts.
Frankly, this is still a solid economy, with the Atlanta GDPNowcast indicating a +5% GDP growth estimate for Q3 ’23. Inflation is receding, the Fed and FOMC have seemed to put the US economy on a soft landing glidepath, but those Treasury yields don’t like the economic growth rate after 14 years of zero rates.
A tougher slog and potentially higher Treasury yields was what prompted this blog post in August ’23.
Noting the bond market’s various “annual returns” from 1-year through the last 15-years in this week’s blog post didn’t garner any attention, but the data looks somewhat bullish given the low returns, but you’d think that’s because the low yields from the last decade. Remember, in 2012 (around the time of the Greek austerity referendum), and 2016 (original Brexit vote), the 10-year Treasury yield traded down to the 1.25% – 1.40% yield range during the Obama Administration.
The fact is, we could see a decade for the Treasury market – after 14 years of zero interest rates – that resembles the decade for the SP 500 from 2000 to 2009.
Watching the 10-year Treasury yield level of 4.35% like a hawk.
Take all of this with substantial skepticism and a healthy grain of salt. None of this is advice, and it’s only written to help me carve out my thought-process for portfolio construction. It’s only one person’s opinion. All SP 500 EPS and revenue data is sourced from IBES data by Refinitiv or from Factset where noted. Capital markets can change quickly for both the good and bad. Evaluate your own appetite for market volatility and adjust accordingly.
Thanks for reading.