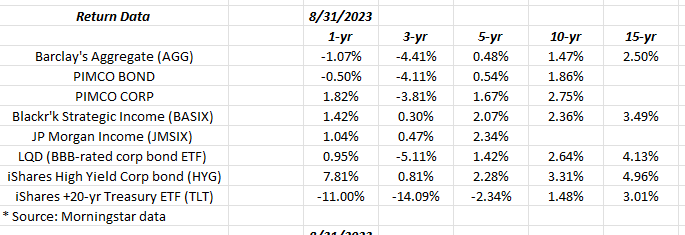
Click on the above spreadsheet table and readers will get an enlarged look at various bond market asset class “annual” returns.
A better comparison would be the CPI (annual) against the above numbers.
Note the 10 and 15-year annual returns.
International:
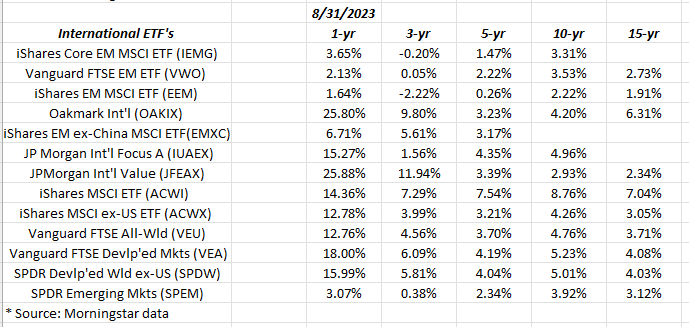
The same affliction is impacting international as the bond market asset classes: 10 and 15-year returns remain subdued. Oakmark International, managed by David Herro, continues to outshine much of the non-US equity asset classes.
Clients 4 largest holdings within the non-US or international universe:
- Oakmark International (OAKIX);
- iShares Emerging Market ex-China ETF (EMXC);
- Vanguard’s Developed Markets Index Fund (VEA);
- JP Morgan International Value (JFEAX);
The only change in the last year to the above holdings was to sell the VEU (Vanguard FTSE All-World ex-US) ETF and swap into the JP Morgan International Value.
The VEU and VEA are essentially identical portfolios if you look at the top 10 holdings hence, it makes little sense to own both.
Major US indices:
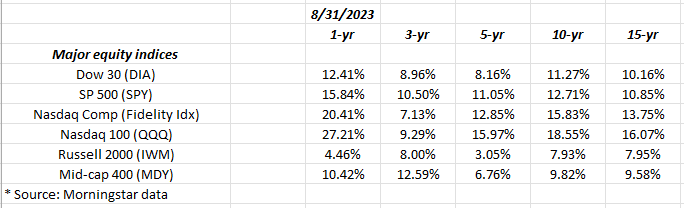
Here’s what’s interesting: looking at the 3-year annual returns, the SP 500 is still outperforming the Nasdaq 100 or QQQ’s, which is likely a surprise to many given the outperformance of the so-called “Magnificent 7” (or top 7 stocks in the SP 500 when ranked by market cap) this year.
The 5-year return for the Russell 2000 (IWM) is now low-single-digits. If the 10-year IWM return gets to mid-single-digits, which is probably an unlikely occurrence, a significant shift in portfolios would be warranted, particularly if the larger-caps continue to outperform in the interim periods.
The 10 and 15-year returns for the Russell 2000 (IWM) and Mid-cap SP 400 (MDY) remain well below their larger-cap brethren.
Summary / conclusion: In the late 1990’s – from 1995 to 1999 the SP 500’s annual return for that 5-year period was greater than 28% per year. That’s a truly remarkable annual return. The Russell 2000’s annual return during that time period was a little over 16% per year. (The IWM wasn’t created until August of 1999.)
In secular bull markets for the SP 500, and I believe we are still in the middle of the latest secular bull market, which started either in 2009 – 2010 or in 2013, (depends on what you consider your starting point for the new bull), when the SP 500 finally made a new and permanent all-time-high in May, 2013, there can be asset classes that lag the main US stock market indices in a material way, and deserve some part of client assets as the bull market continues.
Watch annual returns, and in particular note which asset classes lag the major US indices.
In terms of international, and because of China’s bad behavior, which originally started with the whole Jack Ma and Ant Financial fiasco, all of the VWO and EEM ETF’s ( significant Chinese company percentage) were sold a few years back, and replaced with the EMXC (emerging markets ex-China), but in the last 12 months it’s become apparent China is working side deals with countries like Brazil and others in an attempt (it’s my own opinion) to circumvent dollar strength and improve the position of the Chinese yuan. That’s a significant pull, and probably not very realistic, on China’s part. However the point is, China still exerts a significant influence on the emerging markets, but it’s hard to quantify. I’ve often wondered why own them (emerging markets) at all. However, given the 10 and 15-year returns of the VWO and EEM, at some point, the asset class is likely to rally – if even for a year – and generate some alpha relative to the SP 500.
What’s worrisome today is that – as someone who lived through 2000 to 2009 – the worst decade for stock returns since the 1930’s, where the SP 500 returned (cumulatively) just 12.5% for the decade, or an annual return of just over 1% per year, and that only because of the rally after the March ’09 lows, will bonds and Treasury returns have a similar decade ?
A return of Treasury market volatility, and a potential 5% yield on the 10-Treasury would leave the US stock market behaving like spawning salmon i.e. swimming upstream. This blog post a few weeks was an attempt to flush out a scenario where Treasuries and most bond market asset classes have a lost decade of returns, but I’m not sure it was all that effective.
Take all of this with substantial skepticism. None of this constitutes advice, and past performance is no guarantee of future results. All earnings data is sourced from IBES data by Refinitiv, and return data from Morningstar. All readers should gauge their own response to market volatility and adjust portfolios accordingly.
Thanks for reading.