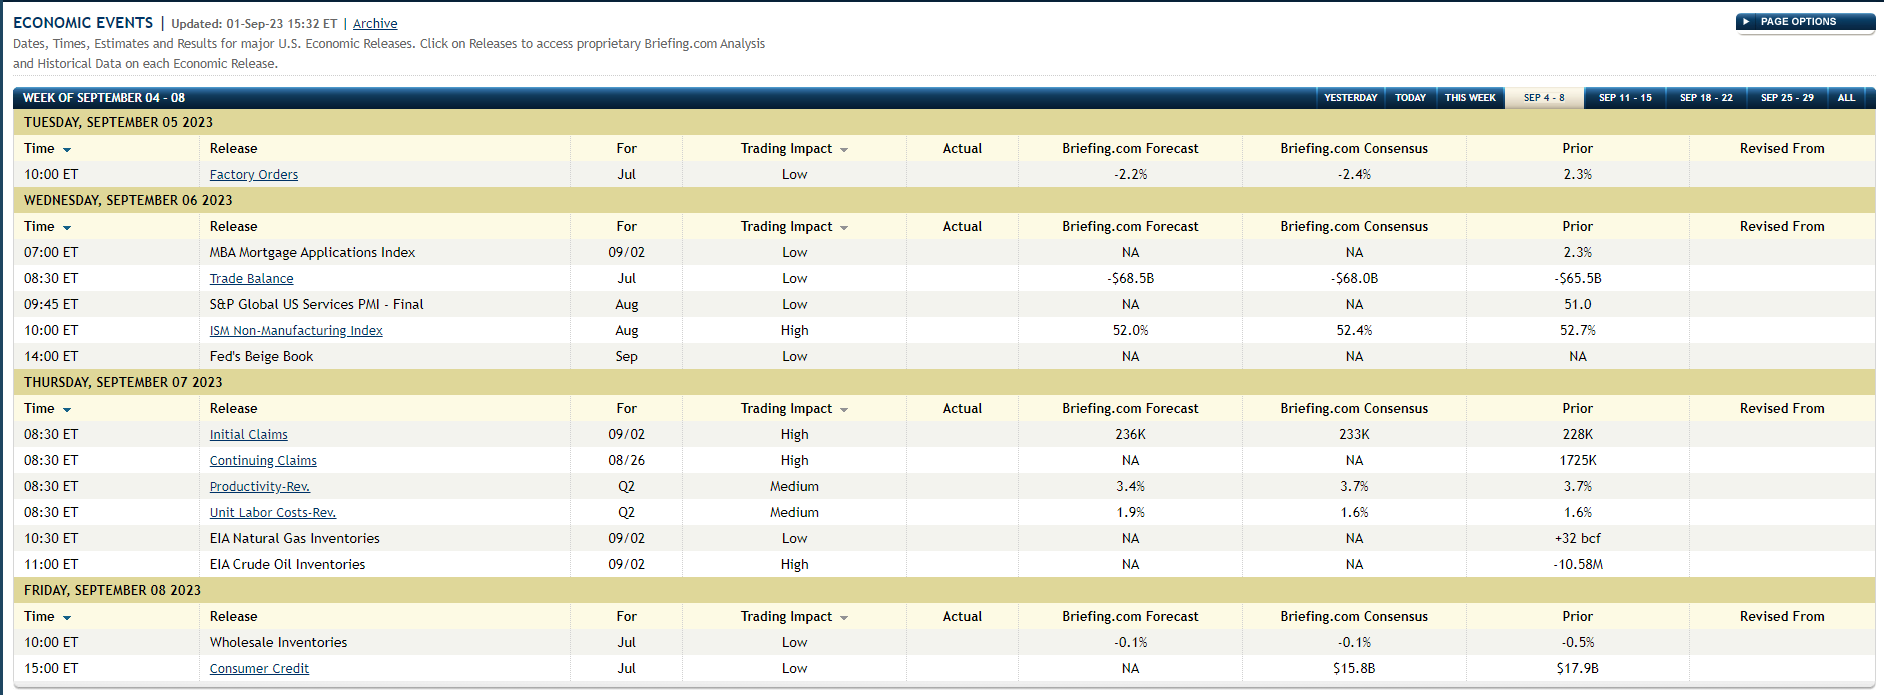
Briefing.com’s economic release calendar for the coming week is quieter than last week’s calendar.
The Services PMI still matters given it’s over 50.0, and unit labor cost data will get a look, as will jobless claims, but the CPI data the following week of September 11th, ’23 is the next important inflation / economic metric.
Companies reporting earnings this coming week:
Docusign, (DOCU), RH (Restoration Hardware (RH), and Kroger (KR) are all scheduled to report their quarterly earnings this week.
Clients hold no positions in any of these names, but the reports will give another look into emerging tech (DOCU with a $10 bl market cap and trading at $50, down from $300 in late ’21), RH, which gives another look at higher-end home furnishings, and Kroger (KR), which will be interesting to watch over the next few years as the Kroger – Albertson’s merger will have to take on Walmart (WMT) in grocery, which is not a battle I personally think Kroger can win.
SP 500 earnings data:
- The forward 4-quarter estimate (FFQE) improved again this to $233.40 from last week’s to $232.80, and is the 8th consecutive week of sequential improvement for the forward estimate;
- The PE on the forward estimate is 19.35, versus 19.80 on June 30th ’23;
- The SP 500 earnings yield fell to 5.17% this after the 2.5% SP 500 rally;
- The Q2 ’23 quarterly bottom-up SP 500 estimate increased marginally to $54.56 from last week’s $54.54 and June 30’s $52.91;
- The SP 500 EPS “upside surprise” for Q2 ’23 is now 7.9%, while the revenue “upside surprise” is 1.7%;
Summary / conclusion: Because of the Labor Day weekend, the update is short and sweet with the goal of publishing more over the next few days.
Michael Santoli does a nice job with CNBC and is a good add to the set the last few years, as he picks out interesting angles to delve into and enlighten viewers.
Michael made the casual comment that SP 500 earnings estimates “are up 3%” since early July ’23, which is factually correct, but what Michael didn’t say was that – to provide some context – is that the typical trend in forward estimates at this point in every quarter is to see lower revisions.
Ed Yardeni – the dean of SP 500 earnings tracking and a very good prognosticator of the annual numbers – referred to this as the “fish-hook effect” and what he means by this is that like a fish-hook, a typical quarterly SP 500 bottom-up EPS estimate or even forward 4-quarter estimate will start higher and then be revised lower as the quarter approaches and then typically bottom the first 10 days of January, April, July and October, and then once earnings start to be released, the typical “upside surprise” kicks in and the SP 500 quarterly EPS estimate ends up (typically) 2% to 5% higher than where it started the quarter.
The point being that the fact that the forward estimate (FFQE) is being revised higher at all at this point in the quarter, is a sign of strength for SP 500 earnings and the fact that it’s continuing to be revised higher each week, indicates the sell-side consensus was too pessimistic on SP 500 earnings coming into the Q2 ’23 releases.
Interest rates matter, and I think they are a wet blanket on the stock market today.
Brian Sullivan interviewed Dan Ives on @CNBC’s “Last Call” on Friday night, September 2 ’23, ( I like Brian’s work and enjoy the show) and Dan Ives being a very popular and highly-regarded tech analyst made an interesting point: he thought 2023 should be compared to 1995 in terms of the tech sector, a year which I lived through as the Netscape IPO signified the launch of the internet boom, and the 5 years of the SP 500 returns averaging 25% per year between 1995 to 1999.
After 2022’s bond and stock returns, which for balanced portfolios were a lot like 1994, my guess is if we didn’t have the “PE compressing effect” of the 10-year Treasury yield and the Fed still leaning towards fed funds rate increases, with the Nvidia results in May ’23, and even their latest quarter guidance for the next quarter, this would have been a much bigger year of SP 500 returns, even though 18.88% as of 9/2/23 isn’t too shabby for an SP 500 YTD return.
Would I rather have weaker SP 500 earnings meaning flat to down SP 500 EPS and lower bond yields ? Maybe, but that’s a “PE expansion” market, meaning regardless of the SP 500 earnings, the lower discount rates leads to higher present values of future cash-flows.
YTD returns for high-yield credit remain pretty stellar. Bloomberg used to carry a daily bond-market asset class summary showing YTD returns for the various bond sectors as of the last night’s close, and I used to track it just to keep an eye on bond market returns in-between monthly downloads of performance benchmarks. On January 1 ’23, Bloomberg stopped providing that data, so – using ETF’s – the attempt has been made to replicate the bond asset class returns. Corporate high yield as signified by the iShares HYG ETF continues to remain firm as it’s YTD return was 6.04% per the Morningstar data as of 9/2/23. Emerging market credit (EMB) is somewhat competitive and the only other asset class that approaches the high yield credit class YTD return. (Within high-yield there is CCC and Single-B bonds, and I have no opinion on any of that without looking at corporate credit spreads and their history.)
With corporate credit remaining well-behaved, it’s tough to envision the SP 500 suffering a serious correction.
Elevated interest rates appear to be leaving us with the “beach ball being pushed under water” effect for SP 500 multiples. Financial media is constantly carrying opinions about the SP 500 PE multiple being “expensive” and dangerous, but the 1987 Crash was preceded by a 28x multiple in the SP 500 that summer and the SP 500 multiple in March, 2000, was even higher.
Personally, I think the SP 500 is setting up for a nice year-end rally.
Take all of this with healthy skepticism, and none of this constitutes investment advice. Past performance is no guarantee of future results. All SP 500 EPS and revenue data is sourced from IBES data by Refinitiv, or Factset where cited. None of the above may be updated in future blog posts and if updated, may not updated in a timely fashion. Readers should evaluate your own appetite for market volatility and adjust your portfolio accordingly.
Thanks for reading.