Five – six weeks into the Iran conflict the most surprising aspect to the SP 500 earnings data is that the sell-side is still revising forward SP 500 EPS estimates higher, for the benchmark, not necessarily for all the components.
- The “forward 4-quarter estimate” ended this week at $319.98, versus last week’s $316.89 for a sequential increase of 1%;
- The PE ratio on the forward estimate is now just 20.3x versus last week’s 21.1x;
- The SP 500 earnings yield jumped to 4.92% this week, the highest print since last April 4th, ’25’s 5.50% at the Liberation Day lows;
- High yield spreads (per Bespoke data) widened this past week to +320 versus the +394 in early April of ’25, again versus the Liberation day wides;
To give readers a perspective on the FFQE versus it’s multiple the last 4 – 5 weeks, here’s the FFQE along with it’s rapidly-shrinking multiple:
- 3/20/26: $319.98, PE is 20.23x.
- 3/13/26: $316.89, PE was 21.1x.
- 3/6/26: $315.89, PE was 21.3x
- 2/28/26: $314.77, PE was 21.85x
- 2/20/26: $313.93, PE was 22.01x
How are 2026 and 2027 SP 500 EPS estimates holding up ?
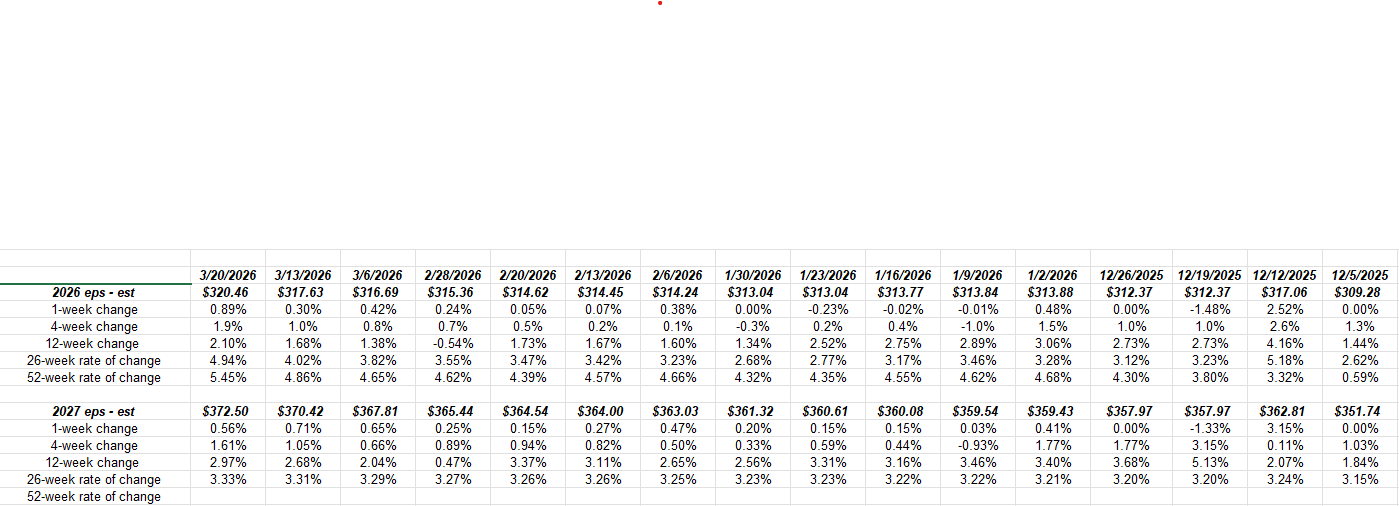
(Data sourced from LSEG, click on the spreadsheet to enlarge)
There is a couple of different ways this blog slices and dices earnings data from LSEG: one is to track the annual EPS estimates published each week and note the “rate of change” for each period on the spreadsheet.
Note how the 26 and 52 week rate of change for the 2026 SP 500 EPS estimates has actually accelerated the last 4 weeks, (i.e. since the start of the Iran conflict).
That’s not something i expected to see given the direction of stock prices.
Sector EPS growth estimate changes for ’26: Technology is Big Revision Winner
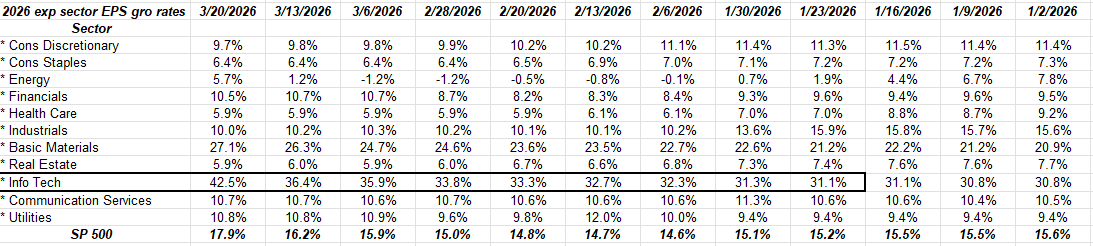
This expected SP 500 sector EPS growth estimates for 2026 shows that technology estimates have been revised S-H-A-R-P-L-Y higher since mid-February ’26, and my educated guess is a a big chunk of this is Oracle (ORCL) and Micron Technology (MU) which reported last week.
Here is something remarkable: take a look at these LSEG consensus estimates for Micron Technology from fiscal ’24 (fy ends August) to fiscal ’27: (as of 3/20/26)
- FY ’28: $79.54 (current PE is 5x)
- FY ’27: $92.35 (current PE is 4.5x)
- FY ’26: $54.30 (current PE is 7.8x)
- FY ’25: $8.02
- FY ’24: $1.21
- PE based on closing price of $422.90 on 3/20/26)
To me that is pretty astounding, the growth in those MU EPS estimates largely from memory growth being used in the Nvidia chips.
What’s interesting about the energy sector estimates looking at the above table is that energy numbers have just started to get a boost the last two weeks. The energy sector, which has shrunk to 3.8% of the SP 500’s market cap versus the 14% – 15% that was it’s previous weight as late September, 2014.
According to TJ Dhillon, my earnings contact at LSEG, the earnings weight of semiconductors and semi capital equipment was 38% of the technology sector in late January ’26. That percentage could be higher now given the growth in Micron’s estimates.
Summary / conclusion: The SP 500 PE multiple is rapidly contracting as EPS estimates are rapidly rising for the benchmark, mainly thanks to technology hardware EPS growth. Is the SAAS-pocalypse over for now ? Oracle’s results and guidance might have put to bed the worries over the AI displacement of the traditional software vendors, but this blog is not an expert on the software application space.
Ultimately, this blog follows SP 500 earnings and revenue revisions.
The first quarter of 2026, ends in about 10 days, and earnings will start another 10 days after that.
The SP 500 is down 5% YTD, which – given the headlines – you would have likely expected a far worse YTD return.
The SP 500 EPS revisions are definitely conflicting with SP 500 price action, which is what makes investors and markets.
By all traditional measures the SP 500 has reached or is getting close to “oversold” status, but we aren’t seeing the “fear” gauges like the VIX hit the extreme near 60, which was it’s April ’25 high around Liberation Day.
None of this is advice or a recommendation, but only an opinion. Past performance is no guarantee of future results. All SP 500 EPS and revenue data is sourced from LSEG.com. This is the first decent market correction since April of ’25. Readers and clients should gauge their own comfort with portfolio volatility and adjust accordingly.
Thank you for reading.