Source: LSEG
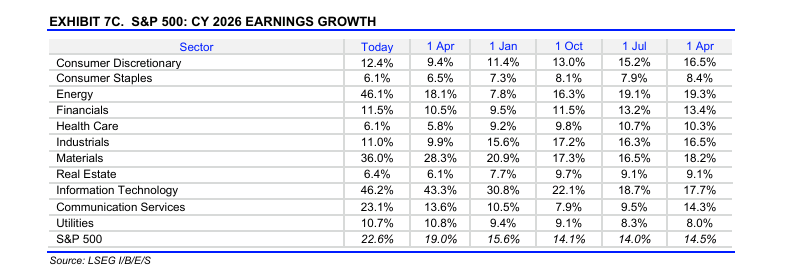
The above chart from LSEG’s, “This Week in Earnings” shows the progression in both sector and SP 500 EPS growth since Jan 1, ’26.
The energy sector EPS estimate – as of May 1 ’26 – has understandably rocketed higher, at +46.1% and is now equal to the tech sector’s +46.2%.
Maybe even more interesting from a data perspective:
Source: LSEG
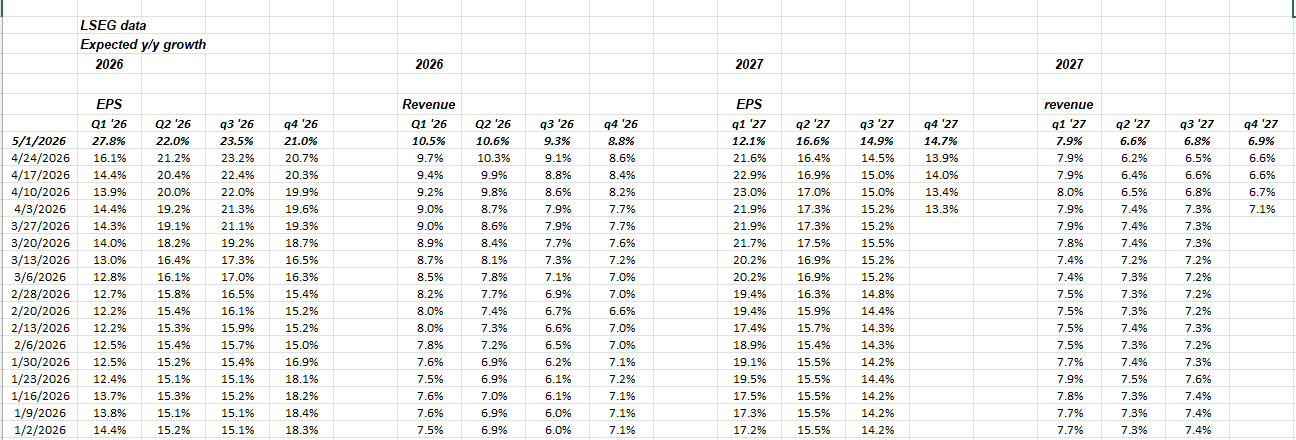
Note the increase in both Q1 ’26 SP 500 EPS growth between last week, dated April 24 ’26, (2nd column from left), and this week’s May 1, ’26 SP 500 EPS growth.
This week’s estimate for Q1 ’26 jumped 11.7% in one week (!), thanks to the mega-cap tech earnings. Also note how Q1 ’27, which is the 11th column to the right, declined as sell-side analysts now expect a much tougher comp in Q1 ’27 thanks to Q1 ’26, expected results.
Hate to be hyperbolic, but these numbers are crazy. (The Q1 ’27 reduction in the EPS growth rate is being checked at LSEG to make sure it’s not an error.)
SP 500 data:
- The forward 4-quarter estimate (FFQE) jumped to $343.64, versus last week’s $342.39;
- The PE on the forward estimate is now 21x.
- The SP 500 earnings yield (SP EY) has now slipped to 4.75%. Anything below 4.5% looks expensive. For comparison, i believe in March, 2000, the EY fell under 2%.
- The SP 500 EPS “upside surprise” hit 11.5% as of May 1 ’26, while the revenue upside surprise hit a 2% upside surprise.
- High yield spreads continue to tighten, after April 3rd’s high +342 to the equivalent-Treasury, now +282 as of this week. (This is a single-spread metric published by Bespoke, daily, and is not meant to represent spreads amongst and between the various high-yield credit sectors.)
“Rates of Change for Forward SP 500 Estimates”
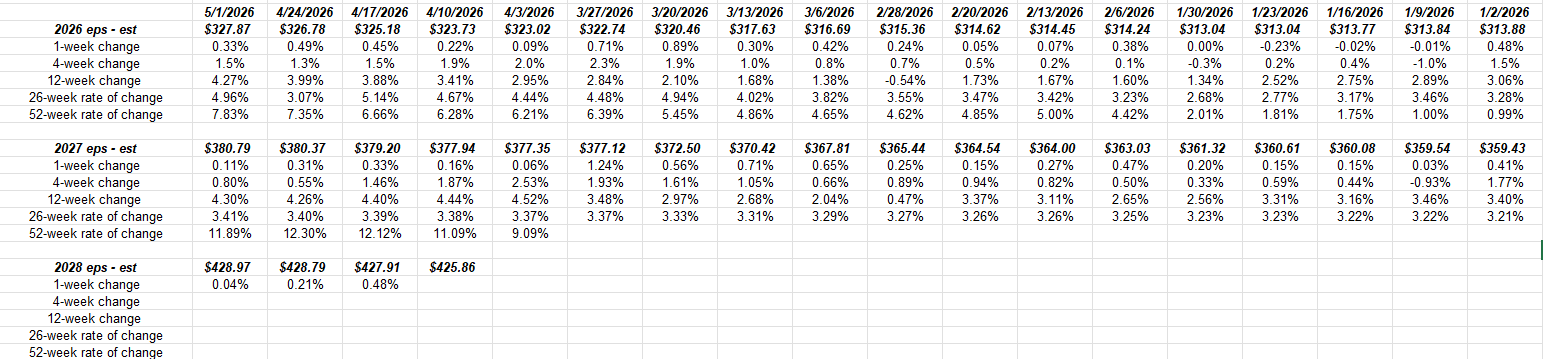
The 2028 expected SP 500 EPS estimates weren’t published by LSEG until early April ’26.
Again, for years the typical pattern for forward EPS estimates was for estimates to weaken as they approach each quarter, and then strengthen with the typical “upside surprise” as actual financial results were released.
That pattern has been broken for a while. The continued positive revisions for forward EPS estimates for the SP 500 is really remarkable.
One final chart from LSEG:
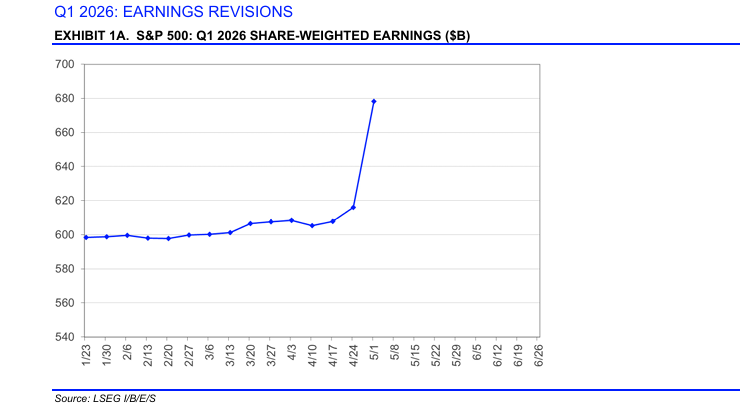
While this chart is labeled “share-weighted” earnings for the SP 500, in fact it’s more equivalent to the SP 500’s “net income” over time.
The remarkable aspect to this is that as of mid-March ’26, net income for Q1 2’6 was estimated to be around $600 billion, but after 314 SP 500 companies have reported, the estimate is now, the estimate is now $680 billion, or a 13% increase. The difference between this number and the actual SP 500 EPS growth for Q1 ’26 is probably “explained” by share repurchases.
Summary: So how do readers invest in a market like this where an ultimate Iran resolution is still unknown, and with the One Big Beautiful Bill coming up on it’s 1-year anniversary, what’s the next catalyst ?
The fact is we don’t know.
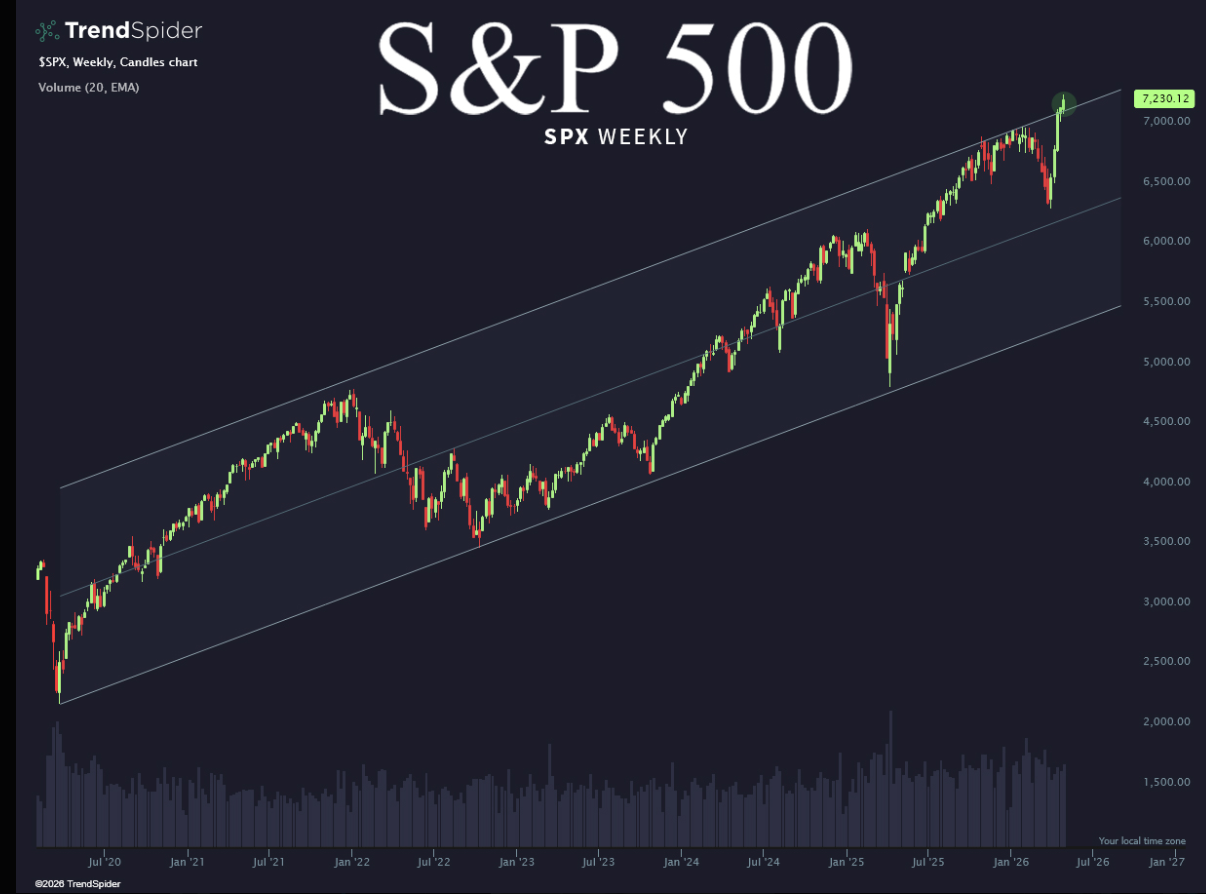
This chart for the SP 500 from TrendSpider which shows the channel for the SP 500 since the 2020 lows, is both a positive from a breakout perspective, and a cautionary tale if that break above the trend-channel line doesn’t fully materialize.
I have to personally wonder too, when do we (investors and readers) see “peak earnings” for the SP 500 ?
It doesn’t appear given the capex builds that were seen last Wednesday night, with Alphabet (GOOGL), Meta (META), Amazon (AMZN) and Microsoft (MSFT), that the AI froth is expected to cool anytime soon.
SP 500 earnings season ends (unofficially) on May 21 ’26, when Walmart reports their fiscal Q1 ’27 or April quarter, 2026, financial results.
Walmart (WMT) went over the magical $700 billion in revenue with their fiscal Q4 ’26 quarterly results reported in mid-February ’26.
SP 500 earnings are way strong. Revenue too, as we discussed last week in this post. At some point lapping these record quarters, could create tough comparisons for the SP 500.
None of this is advice or a recommendation, but only an opinion. Past performance is no guarantee of future results. LSEG is the source of this blog’s SP 500 EPS and revenue information, although Factset is occasionally sourced for data. Readers should evaluate their own comfort with stock market volatility and adjust accordingly. This information may or may not be updated and if updated, may not be done in a timely fashion.
Thanks for reading.
AI=dot.com=Nifty Fifty=Roaring 20’s=Railway mania=South Sea Bubble=Tulip Mania and on and on. Basic food stocks were thrown up. Consumer staples were stapled down. But…..post mania, back to fundamentals which I believe are at bottom levels now.
have no idea what you’re talking about Harvey. it’s an 18-year secular bull market as I’ve written about, which makes me cautious, but the AI spend and tax bill make me bullish. the yin and the yang. Trying to play it both ways for clients.