(Click on above spreadsheet.)
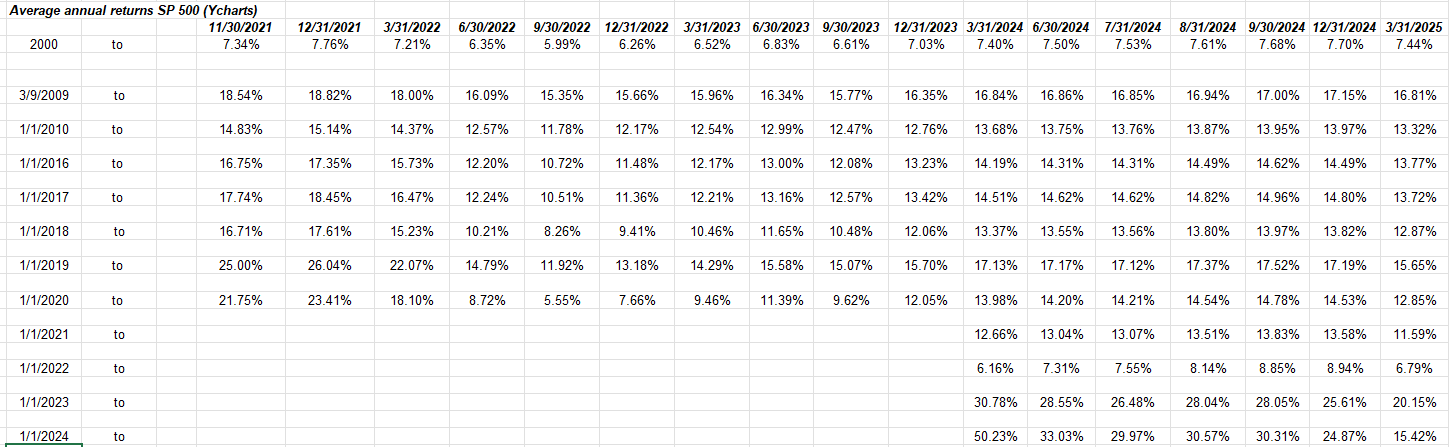
This chart may be puzzling to some, but shows “annual” or what is sometimes called “annualized returns for the SP 500 for various time periods.
- The cell in the upper right hand corner shows the annual return for the SP 500 from 1/1/2000 to 3/31/25: some might be surprised to see that return at 7.44%.
- What’s more interesting to me is the 3rd line from the bottom: from 1/1/2022, or the last 27 months, those SP 500 annual returns are very subdued, less than the 25-year average.
Some might think the Trump tariffs are behind what’s happened in 2025, but after two +25% annual returns for the SP 500 in 2023 and 2024, it wasn’t too hard to think 2025 might be a tougher year.
These SP 500 returns will likely drop even further after next week and April 30th passes.
![]()
(The data is from the tops of the mid and small cap indices in late 2021, and runs through 3/31/25.)
This table shows small and mid-caps (SMID) annual returns since the tops in 2021.
These asset classes never participated in 2023 and 2024 large-cap bull market.
Putting it out there as another perspective. As is always prevalent in the mainstream financial media dumpster fire, the negative voice always wins the day, more so these days because of the political climate.
This bull market has been much less frenzied than the 1990’s.
None of this is advice or a recommendation, but only an opinion. Past performance is no guarantee of future results. Investing can and does involve the loss of principal, even for short periods of time. All data sourced from Ycharts return calculations.
Thanks for reading.