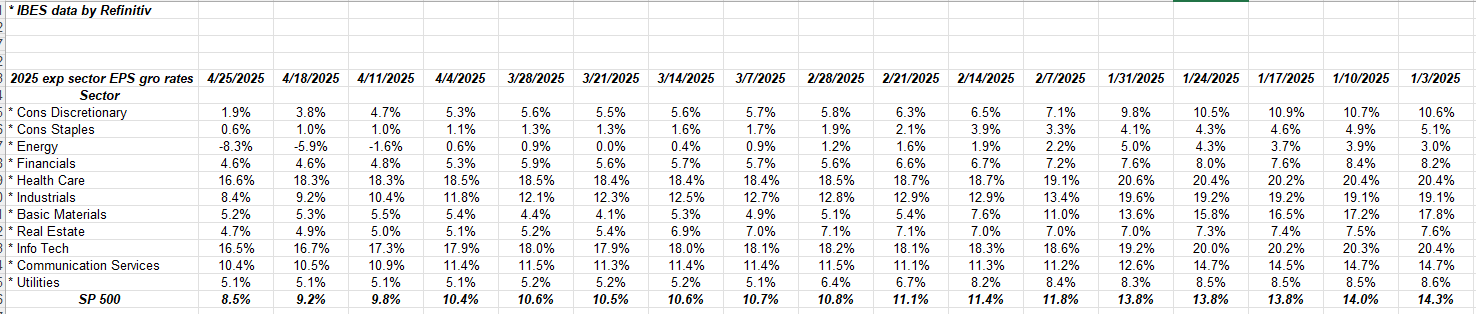
The above chart shows that the “expected” SP 500 EPS growth by sector has lost about 600 bp’s or 6% since the start of the year.
Be sure and scan the consumer discretionary line (first line) and industrials: consumer discretionary is Amazon and Tesla primarily, in terms of market cap weights, while industrials’ expected growth rate has fallen from 19% on January 3rd to 8% currently.
The table above from LSEG looks at the trends expected for 2025.
Let’s take a look at the quarterly numbers:
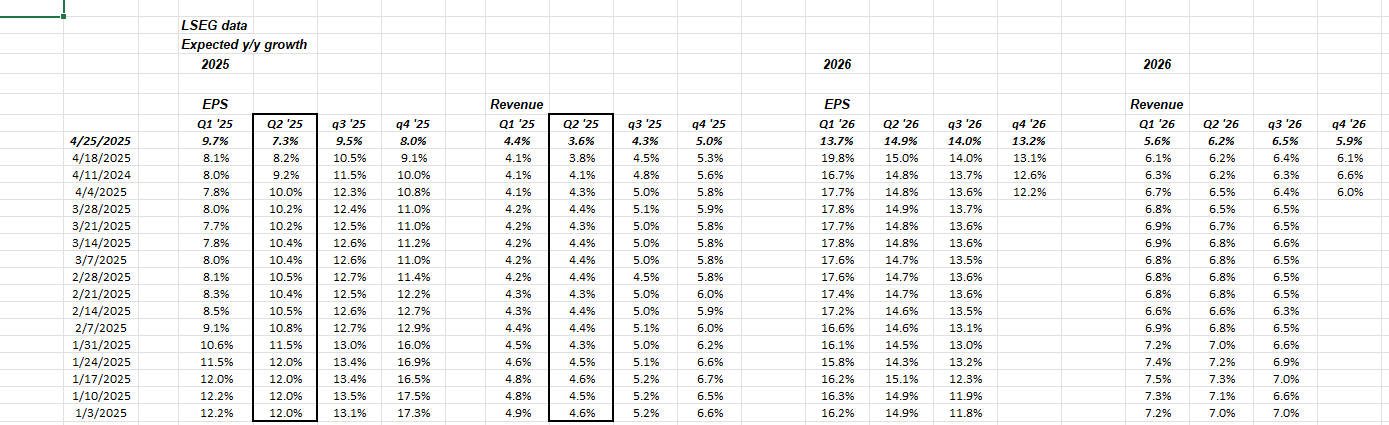
This table looks at expected growth rates by quarter for 2025 and 2026. Similar to the first table but expected revenue growth is shown.
Two important points:
1.) Q1 ’25 SP EPS growth looks pretty strong, (first column): since 4/4/25, expected Q1 ’25 EPS growth has risen 170 bp’s from it’s low of 8% to 9.7% as of today. The typical increase (upside surprise) every quarter is 2% – 5% from it’s starting point. (Factset publishes this data.)
Expect Q1 ’25 earnings to possibly be up 11% – 12% given the pre-ordering in anticipation of tariffs.
2.) Q2 ’25 SP 500 EPS growth is being revised lower: 270 basis points from 4/4/25.
So while Q1 ’25 has been revised up 170 bp’s since April 4, Q2 ’25 EPS expected growth rate has been revised down 270 bp’s from 10% to 7.3%.
SP 500 data:
- The forward 4-quarter estimate this week fell to $272.98, from April 4th’s high of $278.96.
- The SP 500 PE has risen to 20x from 18x in early April.
- The SP 500 earnings yield has slipped below 5% to land at 4.95% this week, still well above mid-February’s lows of 4.42%.
- High-yield credit spreads approved again this week, to under 400.
Summary / conclusion: Q1 ’25 SP 500 EPS growth will likely look stronger over the next 3 – 4 weeks, while Q2 ’25 EPS growth continues to be reduced. Is the reduction in Q2 ’25 EPS part of the “normal pattern” of negative revisions or is it something more ?
With all the nervousness over Q2 ’25 earnings, I’d say there will likely be an overshoot to the downside for Q2 ’25 expected earnings growth, and then the bounce will happen beginning with July ’25 earnings reports.
After Covid in March ’20, the 2nd quarter of 2020 was a disaster, but that was much greater than what we are seeing today since the unemployment rate spiked to 17% (ultimately) and the “stay at home” lockdown was crippling for the US economy.
The earnings data – as well the relentless Wall Street bearishness – reminds me of this time 5 years ago.
We could see mid-single-digit swings in EPS over the next 3 – 6 months, until all tariff issues are defined and the sell-side can get the math right.
Talk of numerous breadth thrusts this week, has technicians quite bullish. Read Ryan Detrick out of the Carson Group and Jason Goepfert (@JasonGoepfert) for better detail on the breadth thrusts.
Historically this is a very bullish sign.
None of this is advice or a recommendation, but only an opinion. Past performance is no guarantee of future results.
Thanks for reading.