Source: LSEG Earnings Scorecard
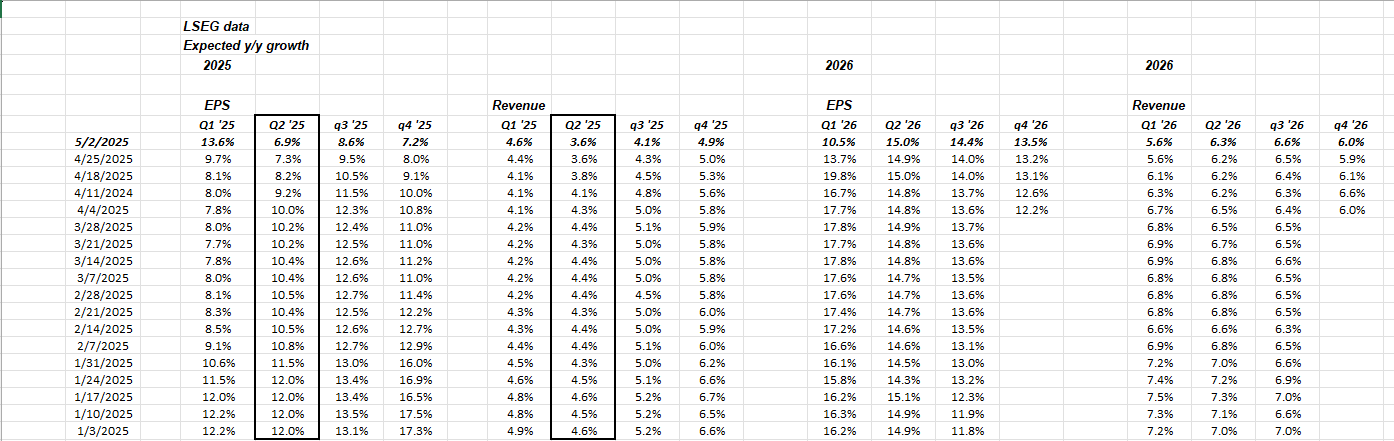
This table shows the sharp jump in just the last week in the Q1 ’25 SP 500 EPS expected growth rate (from +9.7% expected last week to +13.6% expected this week) and the subsequent lower revisions for Q2 ’25.
The upside surprise per the LSEG data is +7% for Q1 ’25 SP 500 EPS, while it’s just +0.9% for Q1 ’25 revenue, showing some margin control within the SP 500 companies that have reported earnings. In Q3 ’24 and then early ’24 we saw +7.5% – 8% upside surprises in SP 500 EPS, but that’s rarified air typically.
Looking at the sector level changes to expected 2025 sector growth rates, the communications services sector jumped sharply this week, likely due to META, to +14.8% from last week’s +10.4%, while technology also increased slightly to +16.8% from +16.5%. Every other sector was lower except financials, which increased slightly.
The Fishhook pattern:
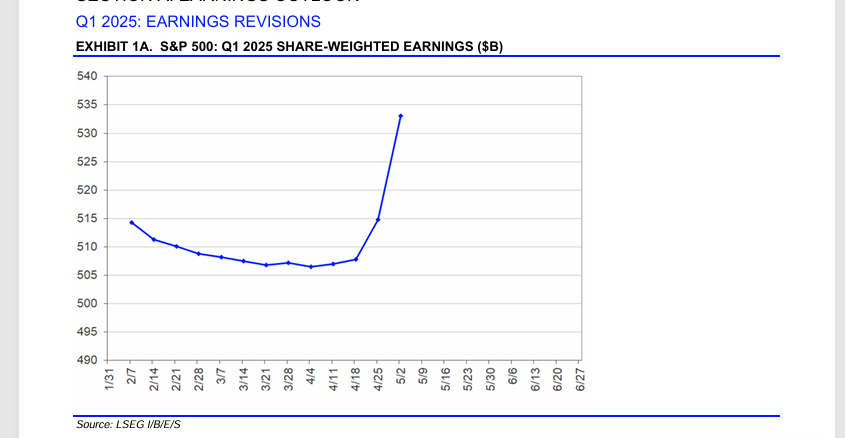
If you have ever heard Ed Yardeni refer to the fishhook pattern, here it is, but it’s actually a reverse fishhook pattern if you look at earnings chronologically.
This pattern repeats itself almost every quarter, where sell-side analysts and strategists grow conservative in front of a quarterly earnings season (in this case Q1 ’25) and lower estimates, only to see the actual results – thanks to the upside surprise patterns – be greater than what was estimated.
What’s interesting for me is that LSEG gives readers “net income” levels, which you can see from the chart started around $515 billion in early February ’25, sank until early April ’25 where expected net income bottomed around $507 billion, and then since Q1 ’25 earnings season began, are now well over $530 billion, and again this is net income, not EPS so EPS would be boosted further from share buybacks.
Summary / conclusion: Don’t try and time the market tracking SP 500 earnings estimates as this article in late November ’24 discussed. Where estimates can be helpful is tracking sector growth rates. Upward revisions to sector EPS growth rates are more telling to an investor than the downward revisions, since the typical pattern to a normal quarter is to see downward revisions for the last two – three months before a quarter is reported.
With the Presidential tweets, headlines and possibly Fed rate cuts coming this year, it seems harder to predict what Q2 and Q3 ’25 might look like from an SP 500 earnings perspective. Fed funds rate cuts usually an unambiguous positive, then there’s the tax bill, etc.
Despite the headlines, there is still a lot of positives that could happen this year, and I’m not a raging bull.
What has impressed me is the changing market leadership year. Non-US, like Europe is +10% through April 30, and the emerging markets saw a little pop today (i.e. EMXC, EEM, VWO) after China signaled last night they are ready to engage with the US on tariffs. As of April 30, 2025, the typical “balanced” portfolio (60% equity / 40% bonds) was down -1.79% YTD.
High yield credit spreads peaked in early April ’25 and have steadily come down. Not so ironically, high-yield spread were at their tightest when the SP 500 was near it’s all-time-high in mid-February.
The tax bill, while it won’t be what was passed in 2017, would help if the corporate tax rate is reduced, but I wouldn’t expect it to be lowered much more than 2% – 3%, from the current 21%. (This is probably not in the strategist EPS estimates for ’25, it’s still a little early yet.)
None of this is advice or a recommendation but only an opinion. Past performance is no guarantee of future results.
Thanks for reading.
More to come this weekend.