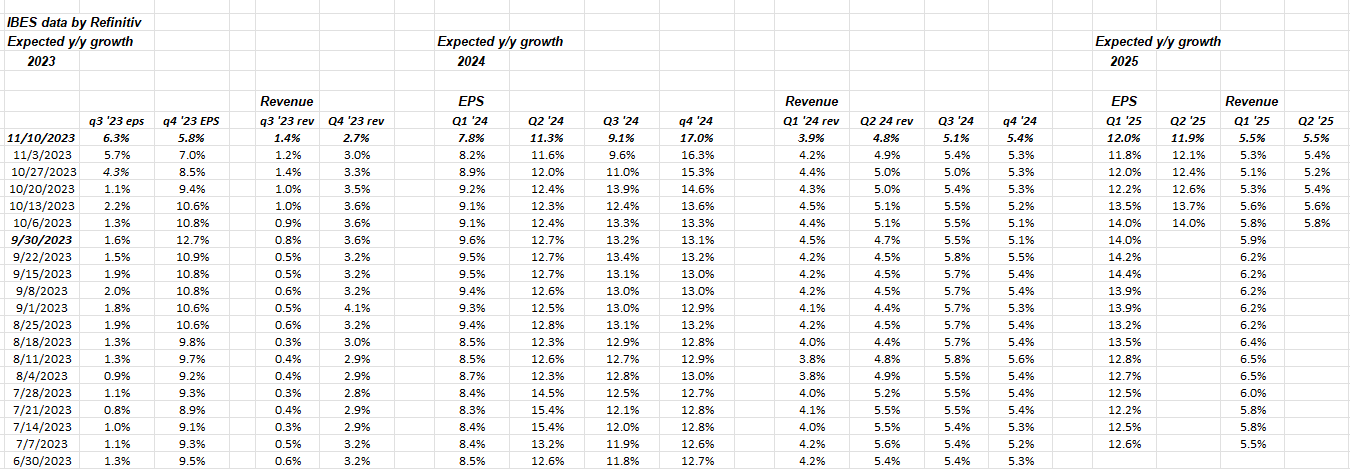
Here’s a table thrown up every few weeks to show readers how the quarterly “bottom-up” SP 500 EPS growth rates are being revised, as well as expected SP 500 revenue growth rates for forward quarters.
Readers should NOT panic about the negative EPS revisions the last few weeks. I do think the trimming or revising of lower forward growth estimates is a reflection the FOMC policy where investors are realizing the Fed / FOMC is on hold, and the labor market is gradually weakening.
There is always a “to and fro” with expected forward growth rates – both EPS and revenue. If readers were shown what was “expected” of Q3 ’23 SP 500 EPS growth rates a year ago or in September – October ’22 – those EPS growth rates slowed sharply in late ’22 and early ’23. The +5.6% SP 500 EPS actual growth rate for Q3 ’23 today (first column on above table) is exactly what the growth rate was predicting in late December ’22, and then this growth rate was revised much lower (low single-digits, i.e. 1% growth) by May ’23, only to get to today’s +5.6% growth with most of the SP 500 having reported.
Q4 ’23 SP 500 EPS growth is seeing revisions lower, and I wouldn’t want to see it go too much lower, but the TYPICAL pattern of SP 500 EPS is to see the sharpest revisions lower or being trimmed, prior to the quarter being reported. Factset and John Butters, put out a statistic on this typical reduction in the next quarter’s SP 500 EPS, so the Factset website to see what’s said about Q4 ’23 expected SP 500 EPS and revenue growth
As was noted last week, keep an eye on the corporate high-yield credit market. If readers are worried about the economy falling off a cliff, and SP 500 EPS growth rates sharply decelerating, my coincident indicator for that is high-yield credit spreads. If high-yield credit spreads start to widen substantially, like they did in 2007, then readers can begin to worry about forward SP 500 EPS estimates in earnest.
Economic data this coming week:
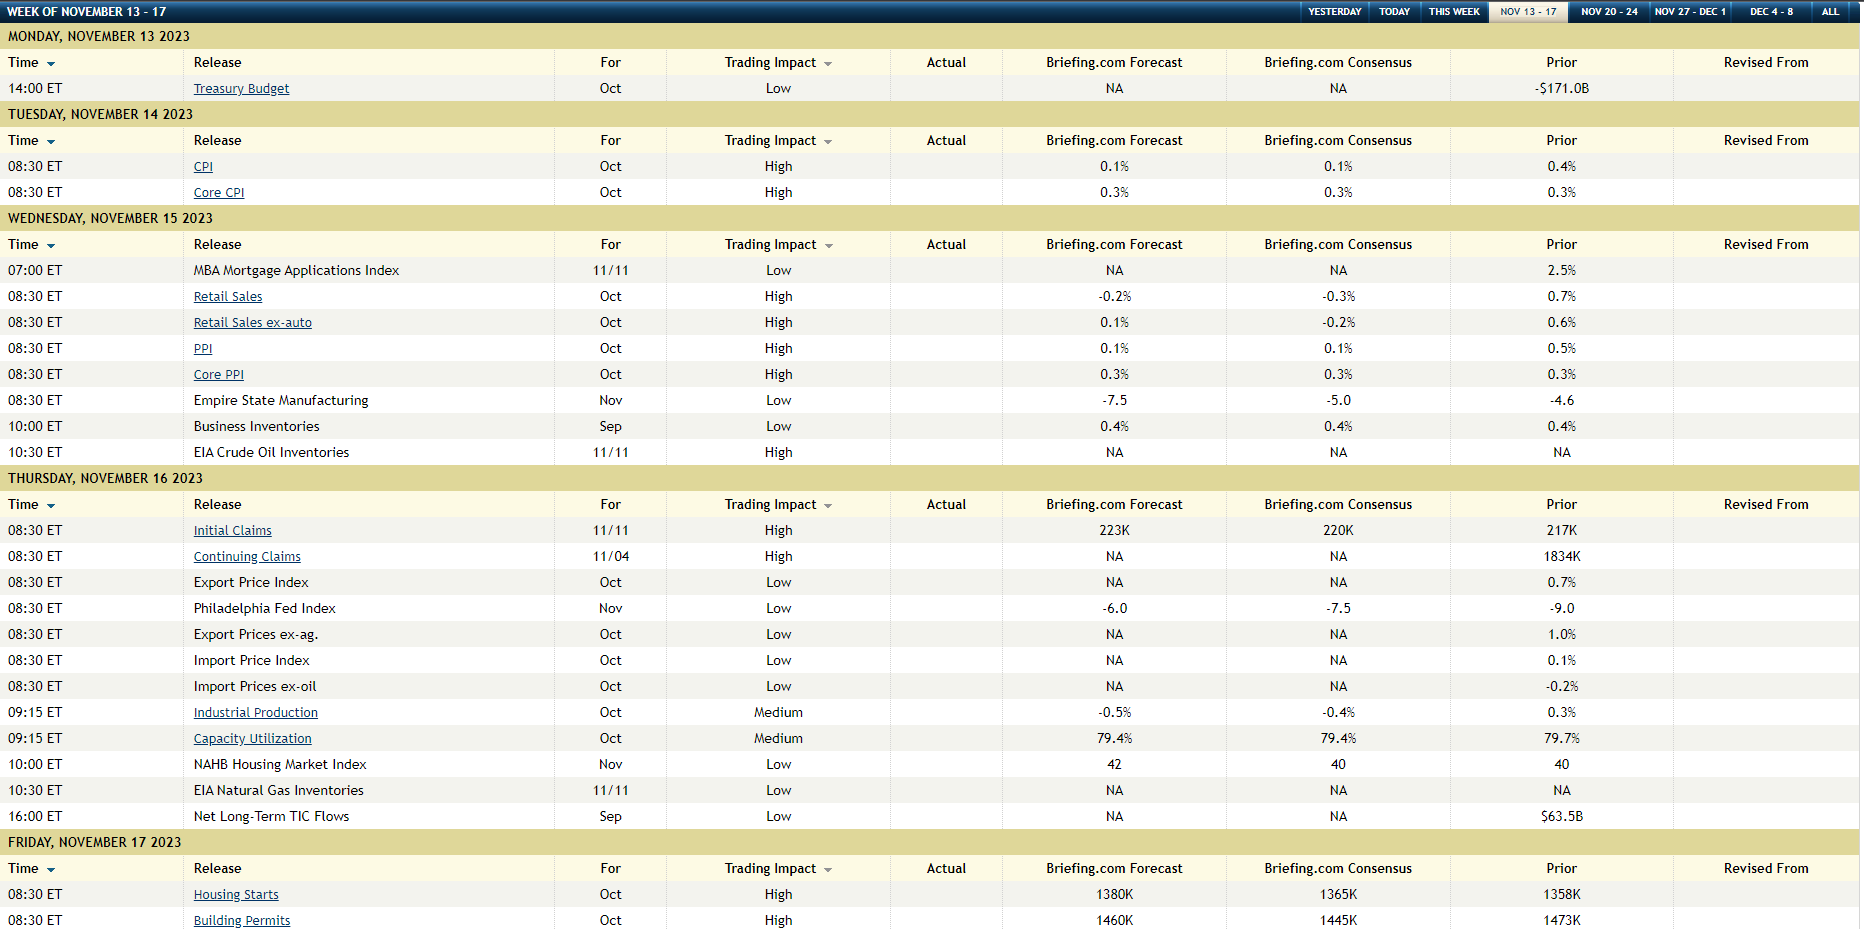
The above table, published by Briefing.com shows the October CPI and retail sales are expected to be released Tuesday morning, November 14th, with the PPI following on Wednesday morning, November 15th, 2023.
Crude oil and gasoline have fallen sharply in the last 6 weeks, with one source (can’t recall) saying crude oil was down 9% in October ’23 alone. This will obviously impact overall October CPI, which is expected to come in at +0.1%, while October Core CPI is expected to run a little hotter at +0.3%. Shelter is 30% of CPI, so while I’ve been reading that national rents are declining, I’d like to see the data confirm it.
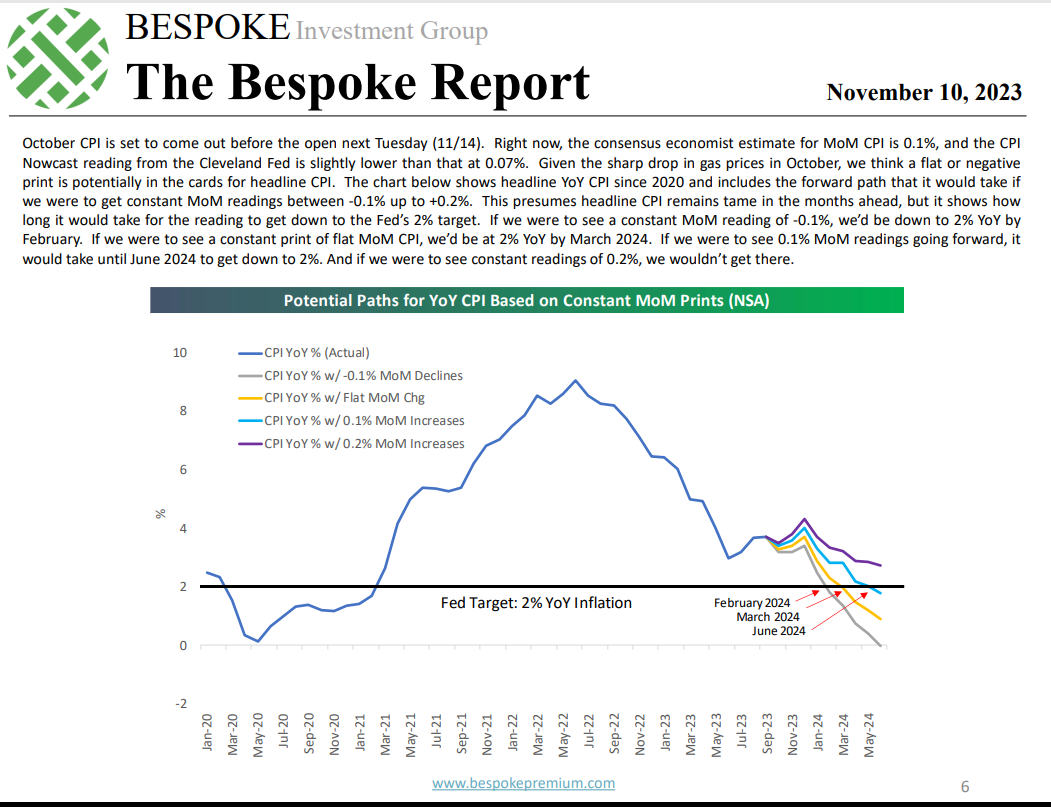
This graph from this weekend’s Bespoke Report shows the potential month-over-month (MoM) CPI path. This is a hypothetical, but as the comments detail it does show how long it might take to get CPI down to the magical 2% level the Fed / FOMC are targeting.
October retail sales Tuesday morning, November 14th, will be important for another look into the US consumer as consumer credit growth has slowed, but even more important will be actual results and commentary for Home Depot’s earnings report for the October ’23 quarter, along with Target and most importantly Walmart, which reports Thursday morning, October 16th, 2023.
These retailers are reporting their October ’23 quarter, so results and guidance will likely influence the Q4 ’23 SP 500 EPS growth, particularly Walmart.
SP 500 data:
- The forward 4-quarter estimate (FFQE) for the SP 500 fell almost $1 this past week to $236.29 from last week’s $237.20 and compared to 9/30/23’s $232.95;
- The PE on the forward estimate is 18.7x this week versus 18.4x last week and 18.4x as of 9/30/23;
- The SP 500 earnings yield fell for the 2nd consecutive week to 5.35% from last week’s 5.43% and the peak of 5.79% two weeks ago;
- Per Refinitiv, the EPS “upside surprise” for Q3 ’23 SP 500 earnings is now 7.1% – that’s still healthy;
- The Q3 ’23 bottom-up EPS estimate is up from $55.92 on 9/30/23 to $58.20 today;
Summary / conclusion: The downward revisions to expected forward growth rates for the SP 500 EPS for Q4 ’23 and then into 2024 bear watching, at least for now. Noting changes like this is the whole point of tracking this data every week, but it’s not actionable yet. High yield credit spreads actually tightened a little this week, per one metric, as did high-grade spreads, but I’m trying to find a broader source for the data.
CPI and Walmart will – in my opinion – be the important metrics for the coming week. Very few people realize that Walmart’s stock traded to an all-time-high this week, even before Microsoft. Here’s this blog’s earnings preview of Walmart from last quarter, August ’23 but there will be an update or an another preview before Thursday morning’s Q3 ’24 earnings report. (Walmart’s fiscal 2024 ends January ’24).
Remember Walmart is expected to generate $642 billion in annual revenue in the 2024 fiscal year.
None of the above is a recommendation or advice, and past performance is no guarantee of futures results. Take all of the above with substantial skepticism, and form your own opinions. Capital markets change quickly for both the good and the bad as this past week demonstrated. All SP 500 EPS and revenue data is typically sourced from IBES data by Refinitiv, unless otherwise noted.
Thanks for reading.