Moody’s (the credit rating agency) drops a cherry bomb on Friday, November 10th, 2023, after the close, watch-listing the credit rating of the USofA’s Treasury debt. Nothing will likely match what S&P did to the Obama Administration in August, 2011, but I suspect the rating agencies are tiring of this never-ending water dance around gov’t shutdowns. November 18th is the next key date. There is a threat of another shutdown with this deadline.
Walmart, Target, and Home Depot report this coming week. Let’s look at fiscal ’23 revenue for each:
- Walmart: $611.3 billion
- Home Depot: $157.4 billion
- Target: $109 billion
- Total: $877.7 bl in revenue (and that was fiscal ’23’s results, which ended in January ’23)
The US has a $25 trillion economy. $877.7 billion is roughly 3.5% of the entire US economy, so these retail giants matter.
Tech stocks:
Apple (AAPL): peaked at $198 on July 20 ’23, coincident with the SP 500’s peak a week later. It’s now back within $10 of that July ’23 high;
Microsoft (MSFT) Peaked at $349 in late ’21, then traded up to $366 also the week of July 20 ’23, but traded through that to a new closing all-time-high on Friday, November 10 ’23, closing at $369. Copilot, MSFT’s AI product was launched 11/1/23.
Amazon: AMZN’s all-time-high was $188 on July ’21, when demand exploded during Covid. Supply-chain and labor issues resulted in subsequent issues within AMZN, but the stock is back above it’s 200-week moving average as of early November ’23. AMZN grew revenue 20% or more from the late 90’s through ’21, but just 9% in 2022. It’s likely AMZN’s revenue growth has slowed permanently, but should re-accelerate from 21’s 9% and ’22 expected 11%, however it’s probably unrealistic to expect that 20% growth streak to ever be repeated.
Nvidia (NVDA): Never modeled or owned the stock directly. Reports November 21, ’23. Fiscal year-end January. Stock peaked at $502 per share in August ’23, now trading at $483. Clients are long the stock through the SMH (semiconductor ETF, where NVDA has a 20% weight).
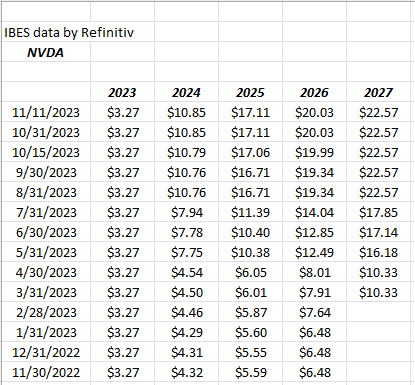
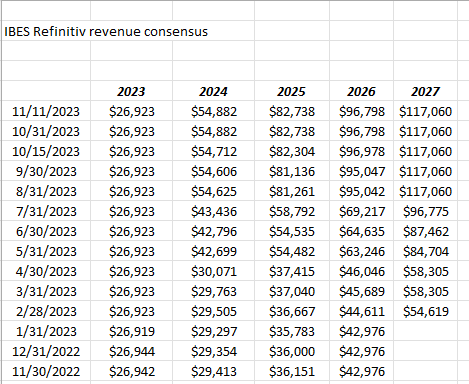
Those are some powerful EPS and revenue revisions. Fiscal ’23 ended January ’23, fiscal ’24 ends January ’24.
Alphabet: (GOOGL): clients are long only GOOGL, and it’s been trimmed a little (not sold entirely from any account, just reducing it’s weight) thanks to the search litigation. It’s probably too cautious, but courts can come up with unexpected judgments, often surprising investors. The stock hit a high of $150 in November ’21, and has been working it’s way back since the late ’22, early ’23 lows, in the high $80’s, low $90’s. The stock sports an 18x PE, with expected 16% growth (average) the next three years. Not expensive at all. Again, the search market share trial was a bit unsettling, watching some of the headlines, but that’s what headlines usually do anyway.
Meta (META): not a very big holding at all, but still hold some with a $20 cost basis from July ’13. The stock hit a high of $384 in Sept ’21, bottomed under $100 in Sept – Oct ’22, and has rallied back to close at $328 on Friday, November 10, ’23. The decline and then rally was all driven by margins getting crushed and then margins being salvaged the last year, primarily from expense savings. Personally I still wonder about the “Metaverse” and what that means, and whether the headsets will ever get traction. I don’t think I know one person that owns one of the headsets. One thing about Mark Zuckerberg, he is remarkably adept at pivoting the company quickly.
Berkshire Hathaway Class B (BRK.B): Berkshire Class B was one of the few financials beating the SP 500 in ’23, but it has slipped back after earnings. The stock peaked at $373 in late September ’23, which was a new all-time-high after peaking at $362 in April ’22, but has again retreated to close on Friday at $350. Like many financials, Berkshire is stuck in this 2-year trading range thanks to the shape of the yield curve, and the SP 500 still below it’s January ’22 all-time-highs.
Tesla: (TSLA): TSLA peaked at $415 per share in November ’21. It traded as low as $101.81 in early ’23 and has rallied since. Lots of chatter about the gross margin, but gross margin compares get easier in Q4 ’23 and into 2024. Here’s the history:
- 3/22: 32% GM
- 6/22: 29% GM
- 9/22: 29% GM
- 12/22: 27% GM
- 3/23: 23% GM
- 6/23: 21% GM
- 9/23: 22% GM
TSLA’s peak gross margin (GM) was that 32% in March of ’22, but it slipped as low 19% and 17% in 2019, so there is a precedent for further downside if Elon Musk wants to push the downside on slashing car prices. If Model 3 gets down to a $25,000 list price, I’ll buy one. (I know Elon Musk reads this blog…) The 200-week moving average for TSLA is right at the $200 level or right where it’s been trading of late.
Top 10 Holdings as of 10/31/23:
- Microsoft (MSFT):
- Oakmark Int’l (OAKIX):
- Blackrock SOI Bond Fund
- JP Morgan Income Bond Fund
- JP Morgan (JPM)
- Cash:
- Amazon (AMZN):
- Nasdaq 100 (QQQ):
- SP 500 ETF (SPY)
- Emerging Markets Ex-China (EMXC)
Since the end of October some of the cash and the fixed-income positions are being re-allocated. Client’s bond allocations are going from a “defensive” to an “offensive” posture by extending duration, although the 10-year and 30-year Treasury yield are still probably fairly valued at these levels.
Past performance is no guarantee of future results, and none of this constitutes advice or a recommendation. All EPS and revenue data is sourced from IBES data by Refinitiv. Capital markets change quickly for both the good and the bad, as we’ve seen in the last two weeks.
Thanks for reading.