Before jumping into Treasury yield curve gymnastics, a couple of errors and omissions from previous posts:
Here’s the Friday, 11/3/23 article on international investing and a chart of the US dollar. The dollar has strengthened since July ’23 as US equities have weakened, but given I wanted to get something up in a hurry for readers, the valuation charts were neglected. Here’s two valuation charts from JP Morgan’s Guide to the Markets, from both 9/30/23 and then 10/31/23:
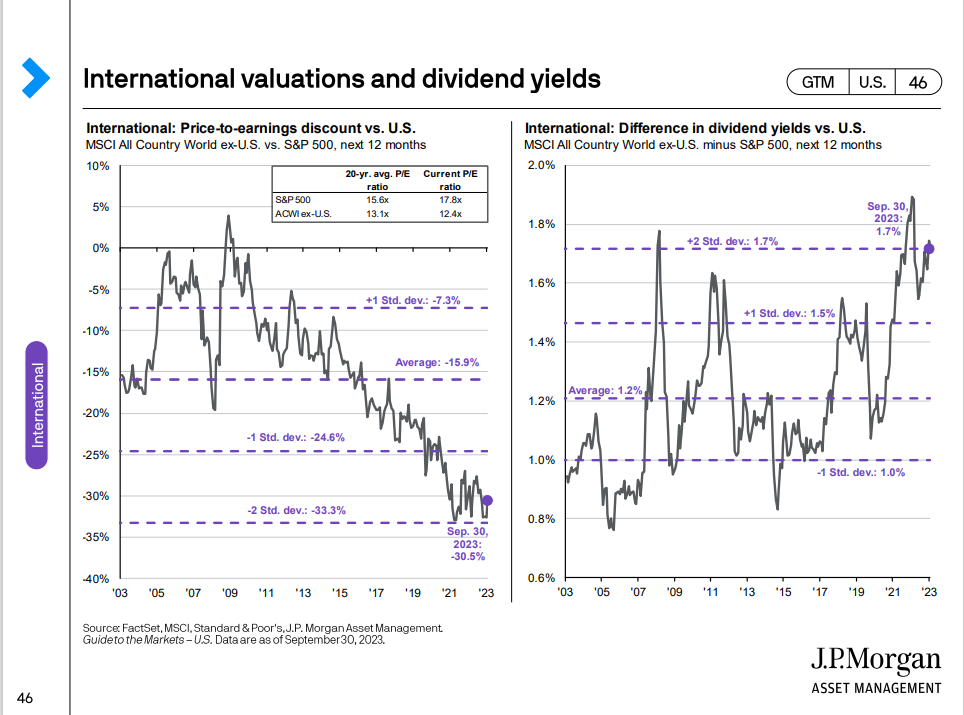
From 9/30/23 above:
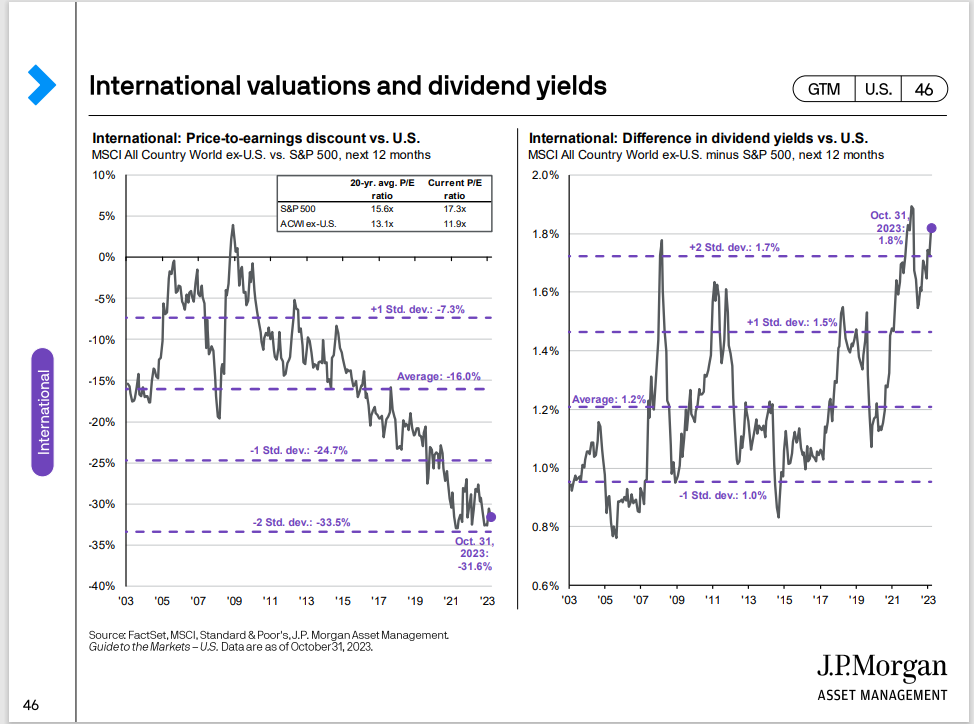
From 10/31/23 above:
The 10/31/23 chart is roughly the same chart as 9/30/23, just 30 days apart. International valuations remain at a significant discount to the SP 500.
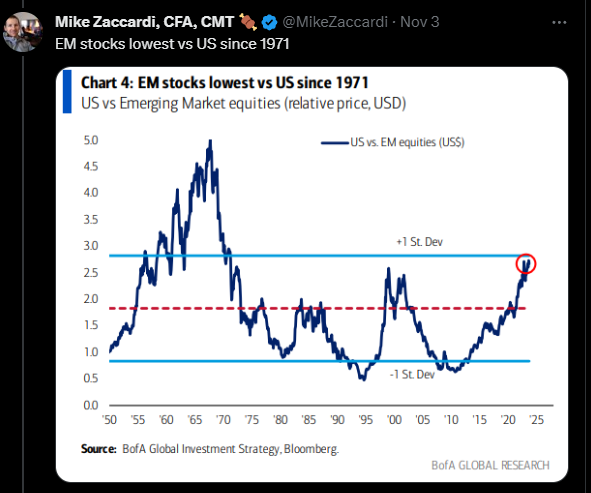
One final chart on emerging markets relative valuation to the U.S. posted 11/3/23 by @MikeZaccardi.
If dollar weakness now persists, lets see how non-US valuation looks at year-end 2023. Two months isn’t a long time but the upside could be swift. As always, the catalyst remains in question.
SP 500 data: (This data should have been with this post this weekend):
- The forward 4-quarter estimate declined to $237.20 from $238.46 and 9/30/23’s $232.95;
- The PE ratio on the forward estimate is 18.4x versus last week’s 17.3x;
- The SP 500 earnings yield dropped sharply on the back of the SP 500’s 4% rally this past week, to 5.43% versus last week’s 5.79%;
- The Q3 ’23 bottom up estimate has now improved to $57.93 from 9/30’s $55.92;
- The SP 500 “upside surprise” or beat rate for Q3 ’23 earnings is still 7% – that’s pretty healthy;
- The Q4 ’23 bottom-up SP 500 estimate has fallen from $58 to $56, which is a 3.5% decline, but within the normal statistical range of negative revisions for a subsequent quarter;
Summary / conclusion: Readers need to see the valuation difference between the US and non-US markets, but understand I could be writing something similar two years from now, making the same case, because non-US markets tend to be more regulated, less free-market oriented, and carry heavier tax burdens.
In Q1 ’16, the 10-year annual return on emerging markets went negative and then 2017 was a very robust year for EM returns, but you do have to pick your spots.
With the 3rd quarter ’23 almost complete, so far there is little in the way of statistical outliers in terms of forward earnings. Forward estimates are declining at a “normal” rate. The 2024 SP 500 EPS estimate is still looking for 11% – 12% EPS growth next year. Some are skeptical of that growth, but more importantly if the FOMC reduces interest rates in 2024, greater liquidity will trump lower EPS.
In Q4, 2018 Jay Powell reversed the tightening course, and in 2019, the fed funds rate was reduced 3 times. SP 500 EPS growth in 2019 was zero, while the SP 500 rose 31%.
None of this is a prediction or advice. Past performance is no guarantee of future results. Take all of this as one opinion. All SP 500 EPS and revenue data is sourced from IBES data by Refinitiv.
Thanks for reading.