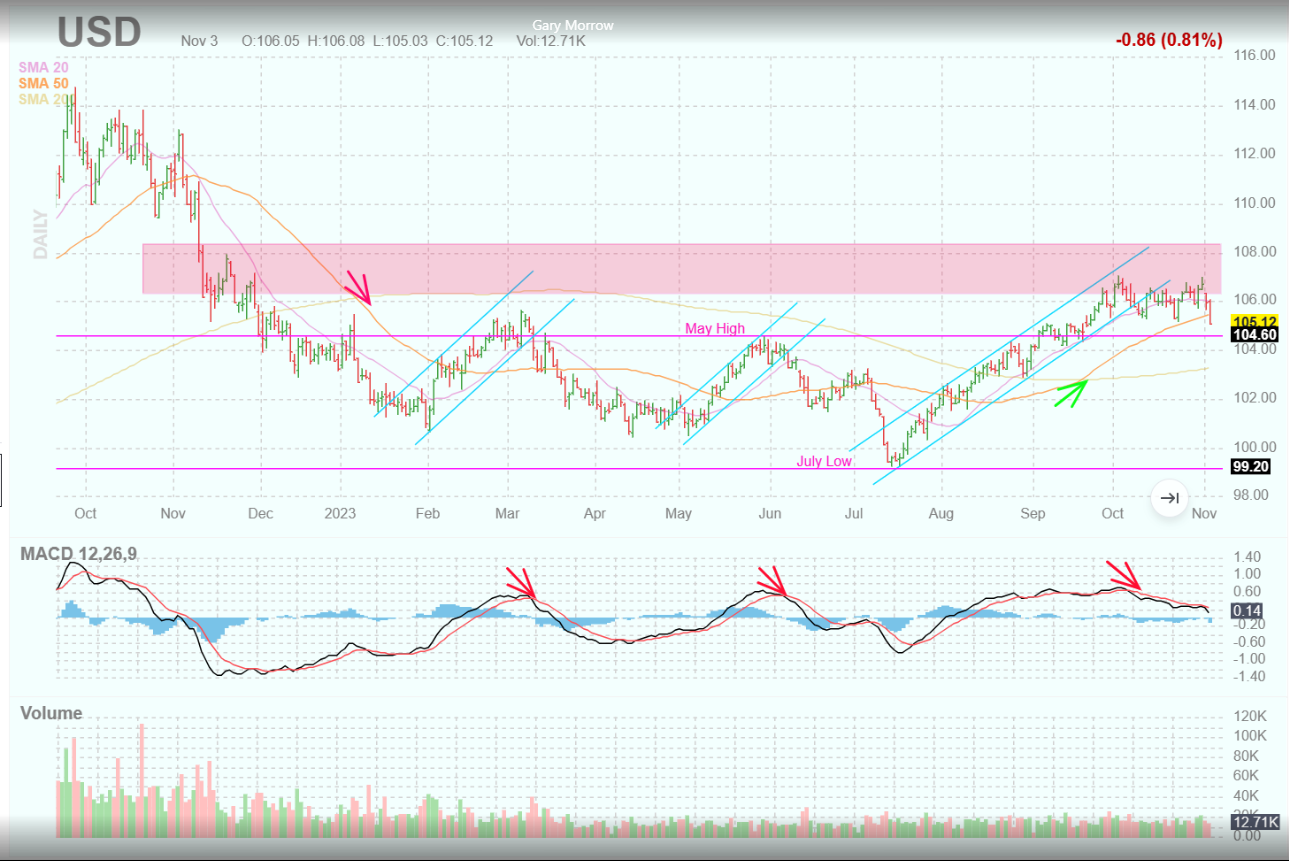
Good chart from Gary S. Morrow (@garysmorrow) showing the dollar backing away from stiff resistance, which is happening just in time for the seasonal, 4th quarter rally, for the SP 500.
The DXY (dollar index) and the UUP (Invesco dollar bullish fund) are lower today on the weaker US payroll report.
As the chart shows it’s been a strong dollar rally the last three months, that started almost when the SP 500 peaked in late July ’23, and it also looks as if the dollar peaked just as the SP 500 tested support near 4,150 – 4,175.
The DXY and the UUP peaked in late September, early October ’22, and despite this rally in late ’23 are still lower than a year ago.
Clients have 4 primary non-US positions:
Oakmark International Fund: (OAKIX) Oakmark Int’l was beating the SP 500 as of July 31 ’23, ahead by about 200 bp’s, up over 22% versus the SP 500’s +20% YTD gain in 7/31/23, but since then has given up all that alpha and then some, closing last week with a YTD return of 1.13%. David Herro’s fund has always been known for it’s volatility, and the last 90 days haven’t disappointed, but if the seasonal rally is here, Treasury yields cooperate, and the dollar weakens, expect Oakmark International to close the gap on the SP 500 once again. (That’s not a prediction.) Oakmark Int’l is a top-10 client position and has been for the last several years.
Emerging Markets Ex-China ETF: (EMXC): The EMXC was up about 14% YTD as of July 31, but as of last Friday, it’s YTD return had shrunk to just over 2%. Emerging markets are lagging the International funds in general, and just haven’t been a good place to be in the last 10 – 15 years, as the SPDR EM ETF has returned just 3.01% over the last 5 years and 2.17% over the last 10 years. (See the attached spreadsheet with annual returns.)
Vanguard’s FTSE Developed Markets ETF (VEA): Even thought it’s a “developed market” index, it’s return this year has correlated pretty closely with the EMXC, probably because the entire globe is feeling / experiencing higher interest rates.
The 4th largest non-US or international position is an international equity fund which won’t be named since I’m not sure how long it will be held.
Annual returns:
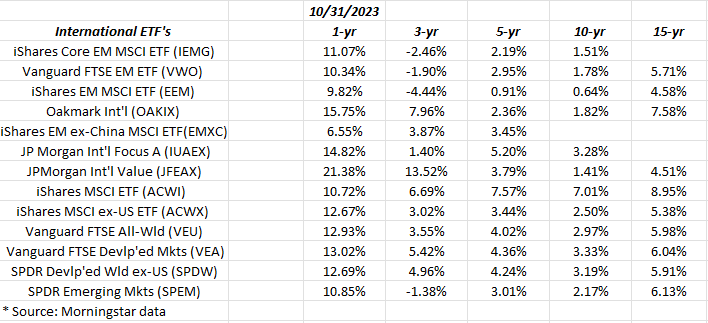
The 3, 5, and 10-year international annual returns for the asset class are still “meh”.
Summary / conclusion: None of this is advice or a recommendation, so take it all with a substantial grain of salt. This gives readers some idea of how clients are positioned internationally in the 4th quarter, as it looks like the dollar is poised to weaken. The positions can change at any time.
As someone who has been managing money since the mid-1990’s, the only time where international equity returns really outperformed the SP 500, was from 2000 to 2007, and it coincided with the peak in large-cap growth in March, 2000, and the fact that China was growing 15% a year for most of the late 1990’s and through that horrid decade from 2000 through 2009 for the SP 500.
Past performance is no indication or guarantee of future results.
Thanks for reading. SP 500 earnings update coming this weekend.