In this post from Tuesday night, the relative attractiveness of the corporate investment grade bond sector was talked about. Unfortunately, a key part of the spreadsheet that is updated weekly was inadvertently left out of the article, which will be discussed in a minute.
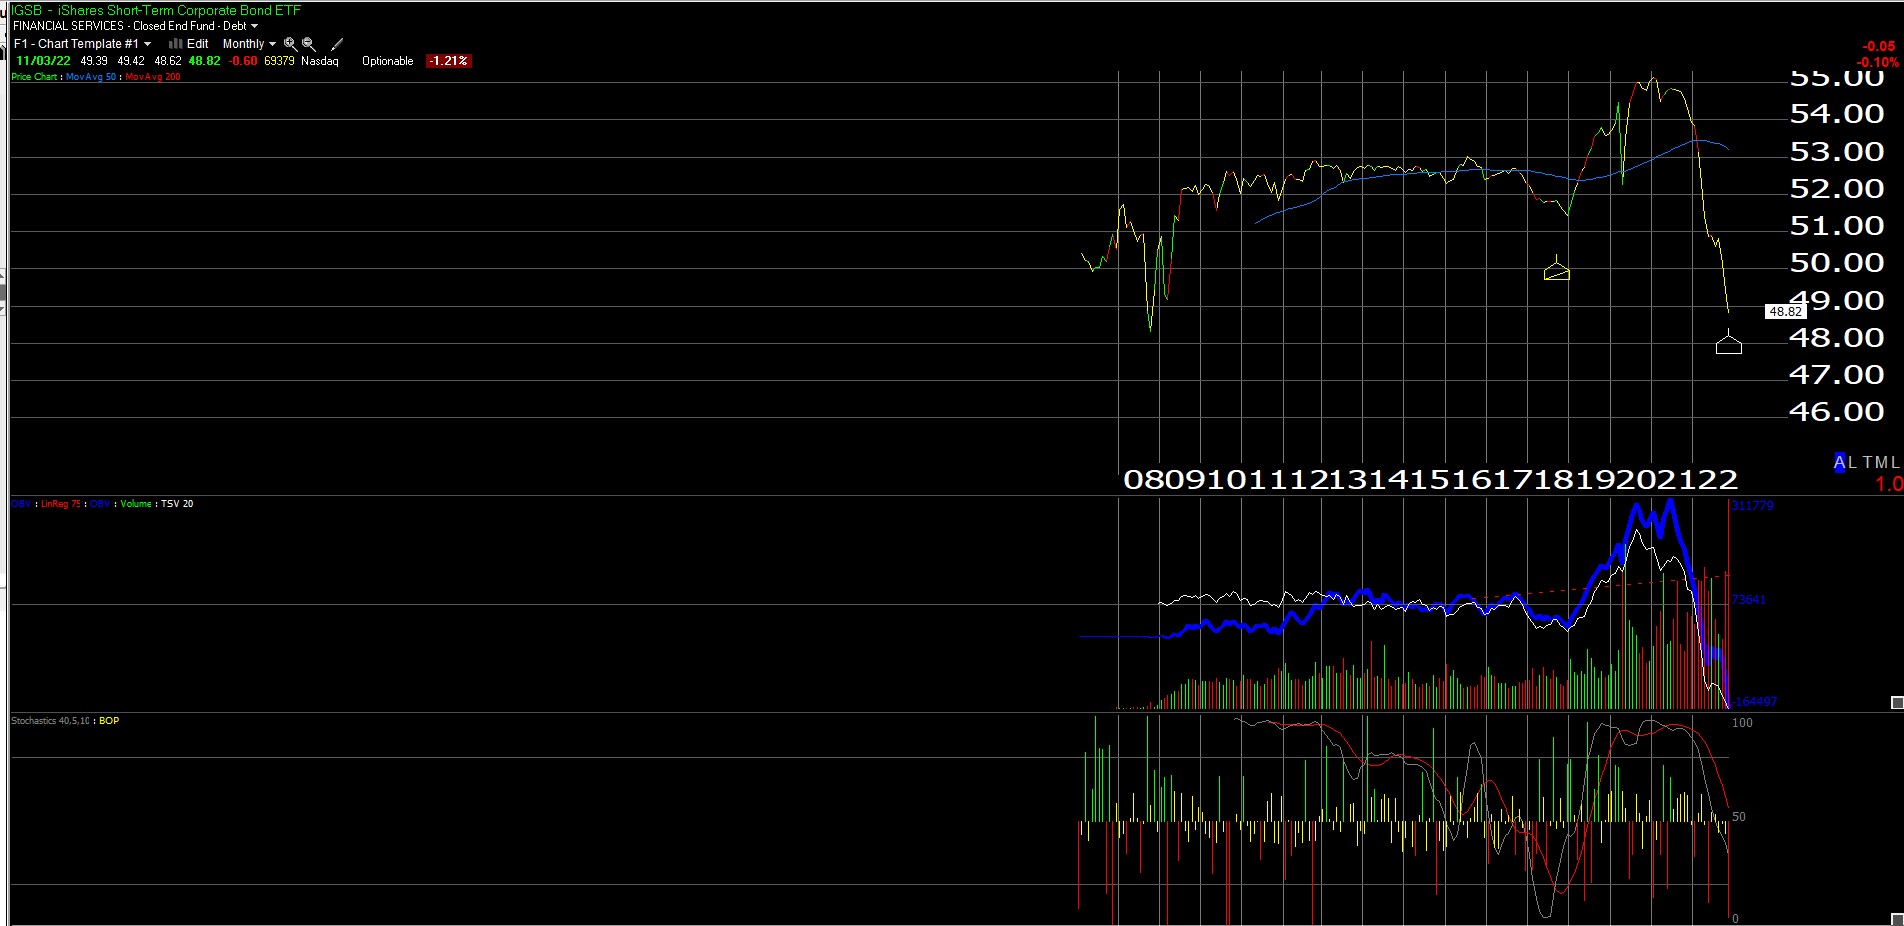
This is a monthly chart of the IGSB or the iShares 1-5 year Corporate Bond ETF. The chart was sent to me by a technician although the chart sent wasn’t particularly legible and thus I swapped that chart for the Worden chart which is much easier to read. The technician – @GarySMorrow – noted that the IGSB ETF is now more oversold than either the 2008 or 2020 lows. (Morrow does a great job – if you aren’t following him on Twitter you should be.)
The low in October, 2008, for the IGSB was $44.88. Today the IGSB closed at $48.82. Per Morningstar data, the SEC yield on the IGSB as of last night’s close was 5.58%. The 2-year Treasury yield closed at 4.70% today, 11/3/22. Remember too, the problem in 2008 was credit, today the problem is duration.
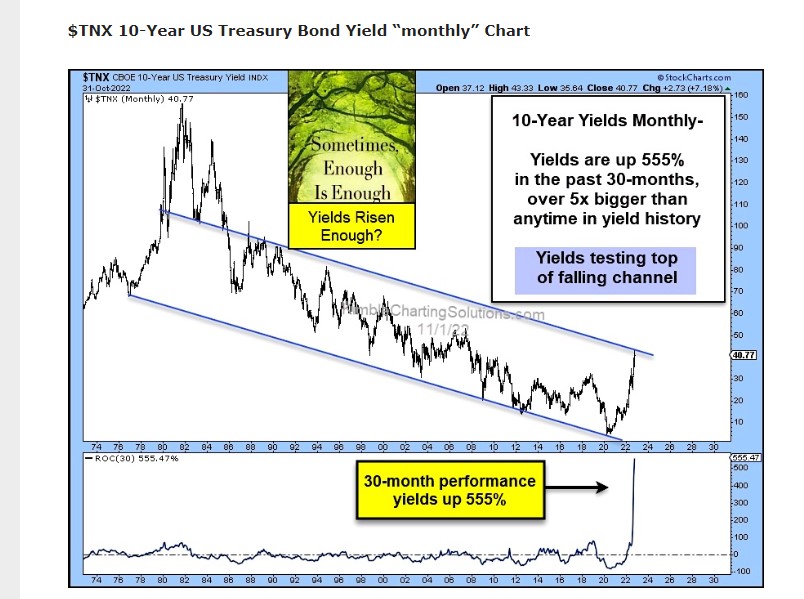
This chart of the 10-year Treasury yield trading range is from @seeitmarket, but it’s originally from Chris Kimble out of Cincinnati.
Note how the 10-year Treasury yield is testing the upper band of the range that dates back to the mid-1970’s.
Have to think that the 10-year Treasury yield is at a key level.
What was missing from Tuesday night’s post ?
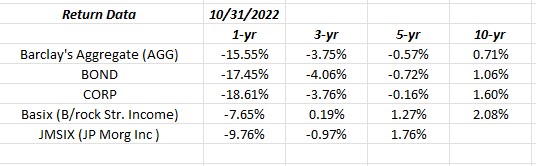
Look at “annualized returns”: the AGG’s 10-year annualized return is less than 1%.
Think about that.
The Barclay’s Aggregate is about 43% government bonds and then split amongst asset-backed/structured (25%), corporates (24%), and municipals, cash, etc. are 8%. Is it a true bond proxy ? That’s hard to say. I see some bond managers use a another blend of the same composition.
Still to have the 10-year annualized return of a bond proxy be 71 bp’s a year, you’d have to maybe think that damage to bond prices from yield increases is getting close to some peak ?
The BOND and CORP ETF’s are both PIMCO ETF’s and the Blackrock Strategic Income (BASIX) and JP Morgan Income Fund (JMSIX) are clients two largest bond fund holdings in 2022, both of which have nicely outperformed the AGG.
Look again at those 5 and 10-year annualized returns for those bond ETF’s and funds.
Summary / conclusion: The pain in bond-land is palpable. The inflation data will be critical as well as the economic data, although the economic data and earnings guidance is already rolling over.
High yield credit is holding up very well.
The one trade that caught my eye today was the EMXC (emerging markets ex-China) ETF that was up on 1.8 million shares traded versus the 400k average, even though the dollar was higher. Sure would be nice to the see the non-US and EM and international start to break correlation with the dollar.
With the October jobs report tomorrow morning, take this all with a grain of salt. Nothing is a recommendation to buy or sell, any security although I have to be honest with readers and say that the IGSB is getting interesting. Past performance is no guarantee of future results. And unfortunately none of this may be updated until I get the time to do so, or not at all.
In 2018, Powell changed monetary policy sharply in the two weeks from the mid-December ’18 meeting to the end of 2018.
This can all change in a heartbeat. The 10-year Treasury yield peaked at 4.33% in late October ’22. A trade above that yield and I think the SP 500 and equity indices get another drawdown of 5% – 10%. The 10-year Treasury yield closed at 4.12% today, despite Powell’s rhetoric from last night.
And oh yeah, the SP 500 is still above the June ’22 lows of 3,636.
Pay attention to the message of the markets.
Thanks for reading.