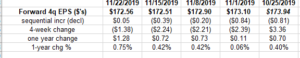
The bottom row of the above section of spreadsheet shows that the “1-year % chg” has now improved for 4 straight weeks (hopefully that will continue) but I’d like to see another few weeks of growth in order to say that the 61 week downtrend has finally turned the corner.
Note the top row too – the dollar estimate for the SP 500 EPS – improved sequentially this week, which isnt all that common.
This is all good from an earnings perspective, but it needs to continue.
SP earnings data – By the Numbers: (Source: IBES by Refinitiv)
- Fwd 4-qtr est: $172.56 vs last week’s $172.51
- Fwd PE: 18x
- Fwd PEG: 24x (Seems high but remember, we are comparing the Fwd 4-qtr estimate with the same estimate 52 weeks prior, or 18 / +0.75% = 24.
- Fwd SP 500 earnings yield: 5.55% vs last week’s 5.53% (Since the forward estimate rose sequentially, so did the earnings yield)
- Y/Y growth of Fwd est: (See spreadsheet above – last row)
- TTM Est: $163.99 vs $163.92
- TTM PE: 19x
- TTM PEG: 3.45x
- TTM SP 500 earnings yield: 5.27% vs 5.25%
- Fwd EST / TTM est: +5.23% vs 5.24%
Summary / conclusion: The numbers might seem strange to readers but they have been explained to the extent possible, without getting too lost in the math. The key metric remains that last bullet point of the “forward” data, which is the “y/y growth of fwd est” which has been trending lower for the last 61 weeks – thanks to the tough y/y growth comparisons from 2018 – but at least for the last 4 weeks have started to improve again. To some extent it’s navel gazing but it’s a perspective of forward earnings you don’t hear talked about much. (Last weekend, this topic was touched on here.)
Most investors simply focus on the 10% expected SP 500 EPS growth for 2020 (per IBES data) but that was 11% five weeks ago and 12% 18 weeks ago. While the calendar 2020 expected growth rate could slide a little as we near year-end, if the forward growth rate starts to grow again, that’s a plus.
The two little “red flags” around the market this week were the slide in junk bond ETF’s (until Friday, 11/22) and the jump in the jobless claims number.
Still, trade commentary dictates everything as Friday’s action proved.
Thanks for reading.