The SP 500 earnings yield (SP EY) jumped back over 5% on Friday, March 27, 2026, to end the week at 5.06%, the first time – per this blog’s internal spreadsheet – since early May ’25 that the SP 500 earnings yield has been over 5%.
On 5/5/25, SP 500 earnings yield ended that week at 5.5%, the highest SP 500 earnings yield this blog has noted, since late January ’24.
As a market-timing measure, the SP EY is an imperfect or inexact timing measure, but it should start getting readers attention along with investor sentiment.
For historical purposes, the SP EY did trade north of 6% for most of 2023, after the FOMC started raising rates off 0% in 2022, so the SP EY can remain elevated for long periods of time.
Energy sector estimates for 2026 start to rise:
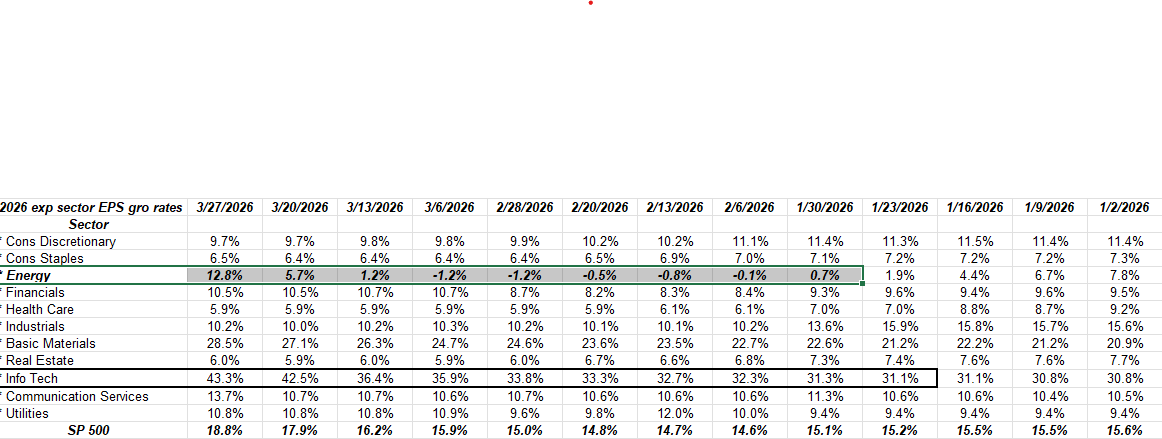
Estimate growth rate source: LSEG.com
Note the jump in the expected energy sector growth for ’26 per the LSEG data as of Friday, March 27th, 2026.
Energy has largely been a dead sector since 2014, and the fact is without the Iran strikes, the world was convinced that the supply and demand for crude oil was largely in balance.
The Big Problem with Technology Valuation:
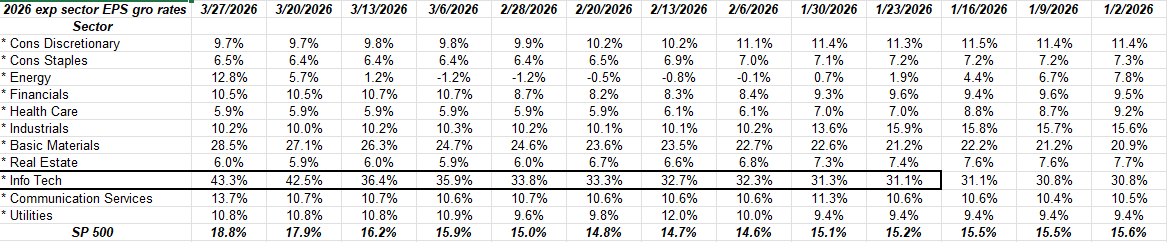
Looking at the spreadsheet above, there is no problem with tech sector earnings; note the growth in “expected” ’26 tech sector earnings for full-year 2026.
Remember though, free-cash-flow is not earnings (EPS) and doesn’t run through income statement. This blog post from July ’24 tried to talk to readers about the difference between EPS and free-cash-flow, which is one of the fundamental underpinnings of a stock’s valuation. EPS is an accounting function, and frequently contains many non-cash expenses: the basic valuation formula is, without getting too deep into the weeds (extrapolating FCF forward, discounting it back, etc.):
- cash-flow-from operations,
- less capex,
- equals free-cash-flow.
The growth in capex for the hyperscalers is so large today, it’s historically unprecedented. But that capex doesn’t show up anywhere in the income statement, but is rather capitalized, and run through the cash-flow statement.
Thus, while EPS growth looks tremendous for investors, the problem is tech valuations could shrink as free-cash-flow gets continually pushed lower as capex grows.
The goal today is not get too wonky with the Saturday morning blog.
The cold hard truth about managing money is you have to worry about everything. Will this wild capex growth eventually cause major revisions lower in tech sector valuations ?
Summary / conclusion: The goal of today’s blog post was to show that the SP 500 Earnings Yield has moved above the critical 5% yield level, therefore, finally the SP 500 could be said to be getting back to a more reasonable valuation. A 5% EY could imply for some a 20x PE for the SP 500 benchmark, which again is more reasonable than January’s and February’s PE valuation levels.
None of this is a recommendation or advice, but only an opinion. We are starting to get a whiff of fear in the stock and bond markets – not as bad as the 60x VIX in early April ’25 around Liberation Day – but the VIX finished the week of 3/27/26 over 30. Readers and clients should gauge their own comfort with portfolio volatility and adjust accordingly. LSEG is the primary source of this blog’s SP 500 EPS and revenue estimates and history.
Logic would tell us there is still more downside to stocks, with much dependent on crude oil prices. Brent should stay below the $115 – $122 level, and I’d like to see West Texas Intermediate (WTI) remain below $100.
The Friday before the Iran air strikes started, WTI closed that Friday, 2/27/26, at $67.02 per barrel.
Thanks for reading.