![]()
Starting off a little differently this week, click on the above excel spreadsheet and note the expected annual SP 500 EPS growth for ’25 through ’27, since June ’25.
Note the improvement in ’25’s annual expected EPS growth in the last 6 months.
Rate-of-Change analysis:
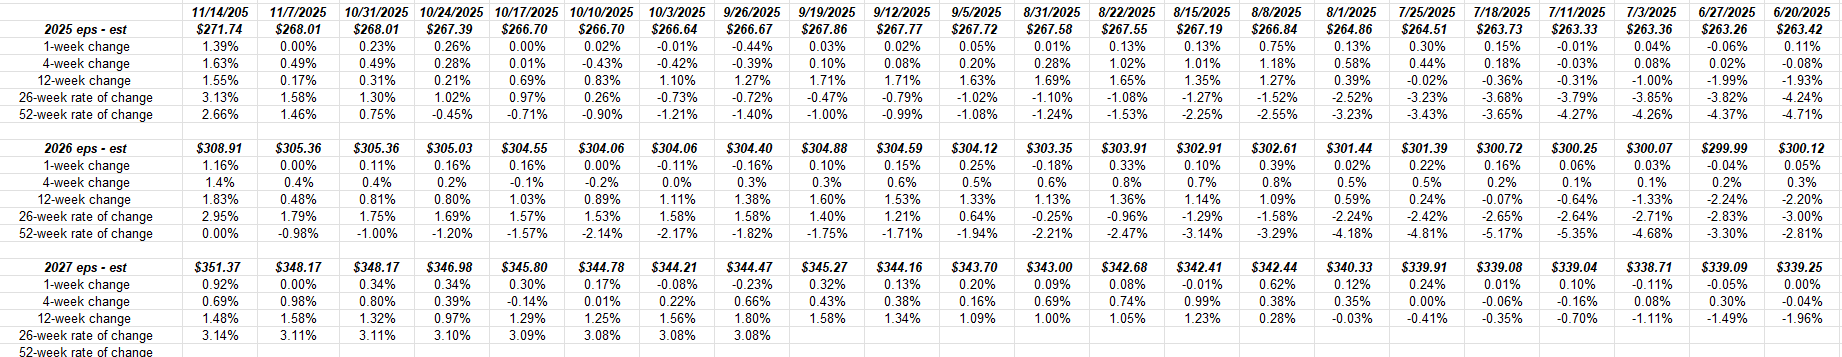
Using the raw EPS estimate data, let’s look at the rate-of-change for SP 500 EPS since late June ’25.
Note how negative the 2026 EPS estimate “rate-of-change” was in late June ’25, and the actual rate-of-change, 5 – 6 months later.
(All the SP 500 raw estimate data is sourced from LSEG.)
The “typical pattern” for forward years in terms of estimate is to see mildly downward pressure in forward estimates given the uncertainty of the future. Instead, today, the sell-side analyst community has their foot firmly on the gas in terms of SP 500 estimate revisions.
Don’t fight the trend, even though it’s well known now.
The signal that this trend is changing is when companies start issuing “lower-than-expected” guidance, or even missing quarterly results.
Style-box update:
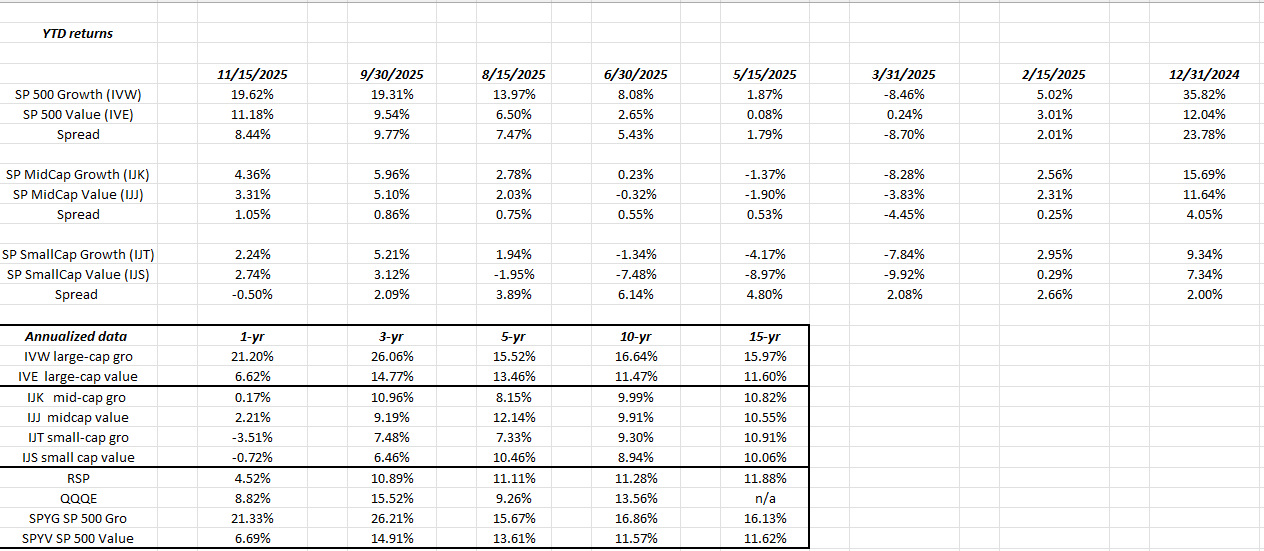
Every 6 weeks this blog prepares a style-box update looking at the annual returns of the various US investment styles over time.
Every style except large-cap growth actually looks investable and lower-risk, but to be in mid or small-cap means you have dramatically underperformed the SP 500 as you can tell by the data.
The performance spread of large-cap growth, even over large-cap value is just although large-cap growth is having a less robust year in 2025 than in 2024 and 2023.
Summary / conclusion: The foot is still firmly on the gas when looking at the next few years of “AI” within large-cap tech, communication services (Alphabet and META) and consumer discretionary (Amazon and Tesla).
The one red flag that is waving is that after +25% returns for the SP 500 in 2023, and 2024 and now a YTD return for the benchmark as of 11/15/25 of +15.65%, usuallt the 4th year is low-single-digits or negative. This blog has written about these return patterns in the past, and very few streaks have gone 4 years. Only one – the last 5 years of the 1990’s – has gone 5 years and those returns were unprecedented.
2026 could be a tougher year, even with the expected 14% expected EPS growth rate next year, although this blog said the same thing at roughly the same time last year.
None of this is advice or a recommendation but only an opinion. Past performance is no guarantee of future results. LSEG is the primary source of all earnings related data. None of this information may be updated, and if updated may not be done so in a timely fashion. Readers should gauge their own comfort with portfolio volatility and adjust accordingly.
Thanks for reading.