To say that we are in an unusual period for SP 500 earnings isn’t an exaggeration given the continued upward pressure on SP 50 EPS estimates that is being seen, week in and week out.
First though, a couple of interesting charts:
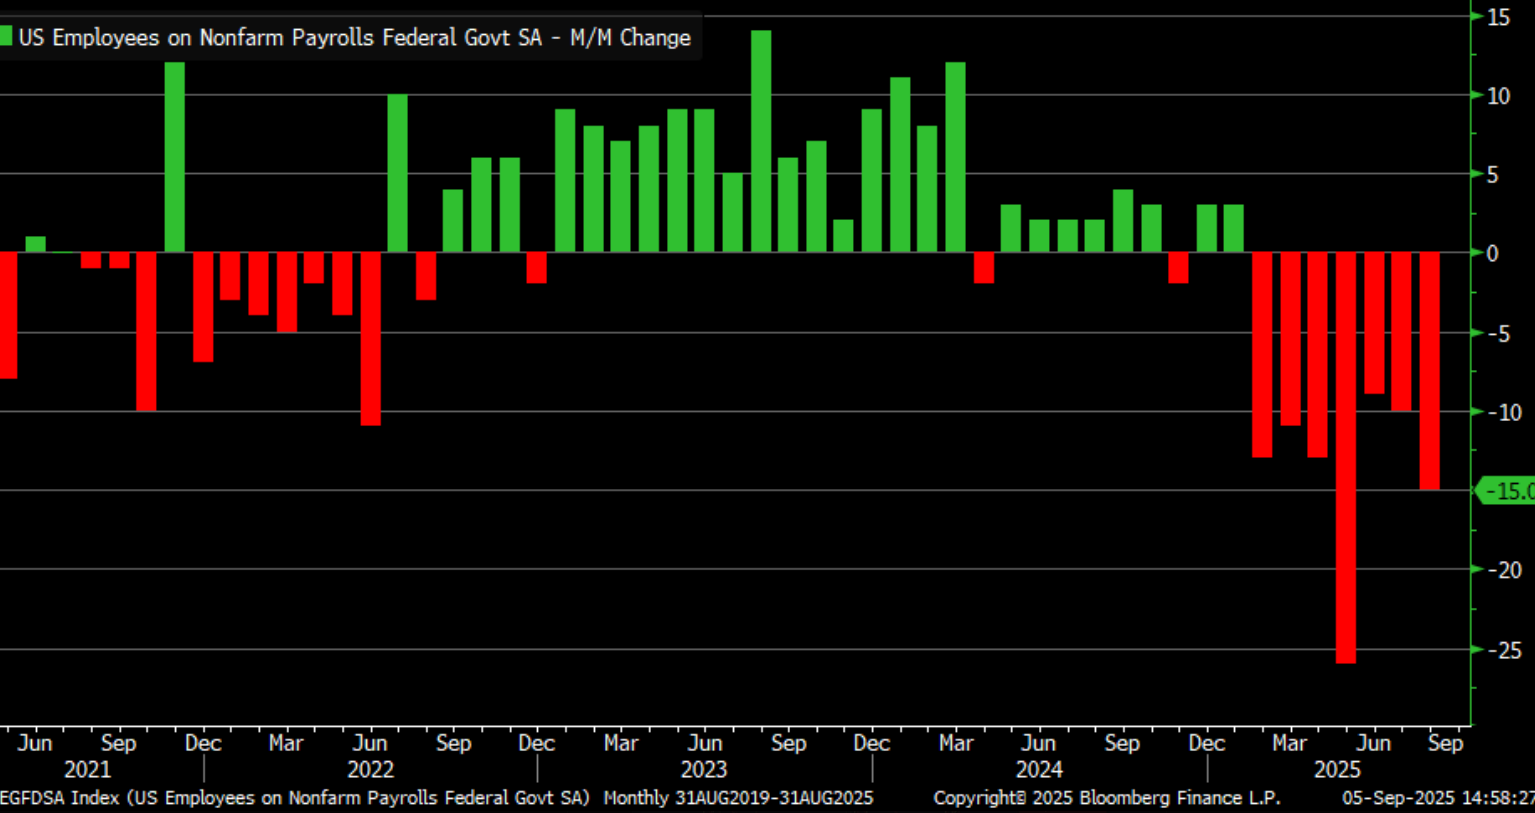
From Kevin Gordon at Schwab, this is a bar chart of net gov’t payroll gains and losses over the last 4 years. While we havent heard much from DOGE since Elon Musk left Washington, have to think some of this weakness is the work of that group, and also the Department of Education’s gutting by President Trump.
According to Brian Wesbury over at FirstTrust, in his August payroll report analysis from last Friday, September 5th, President Trump has been directly targeting government employment, which are down 85,000 versus January, excluding the Post Office and the Census workers.
The fact that the the high-yield credit market hasn’t shown a lot of weakness in recent months despite jobs softness is a good indicator, that of the “private vs public” sectors, the private sector job weakness may not need to be worried about too much (yet).
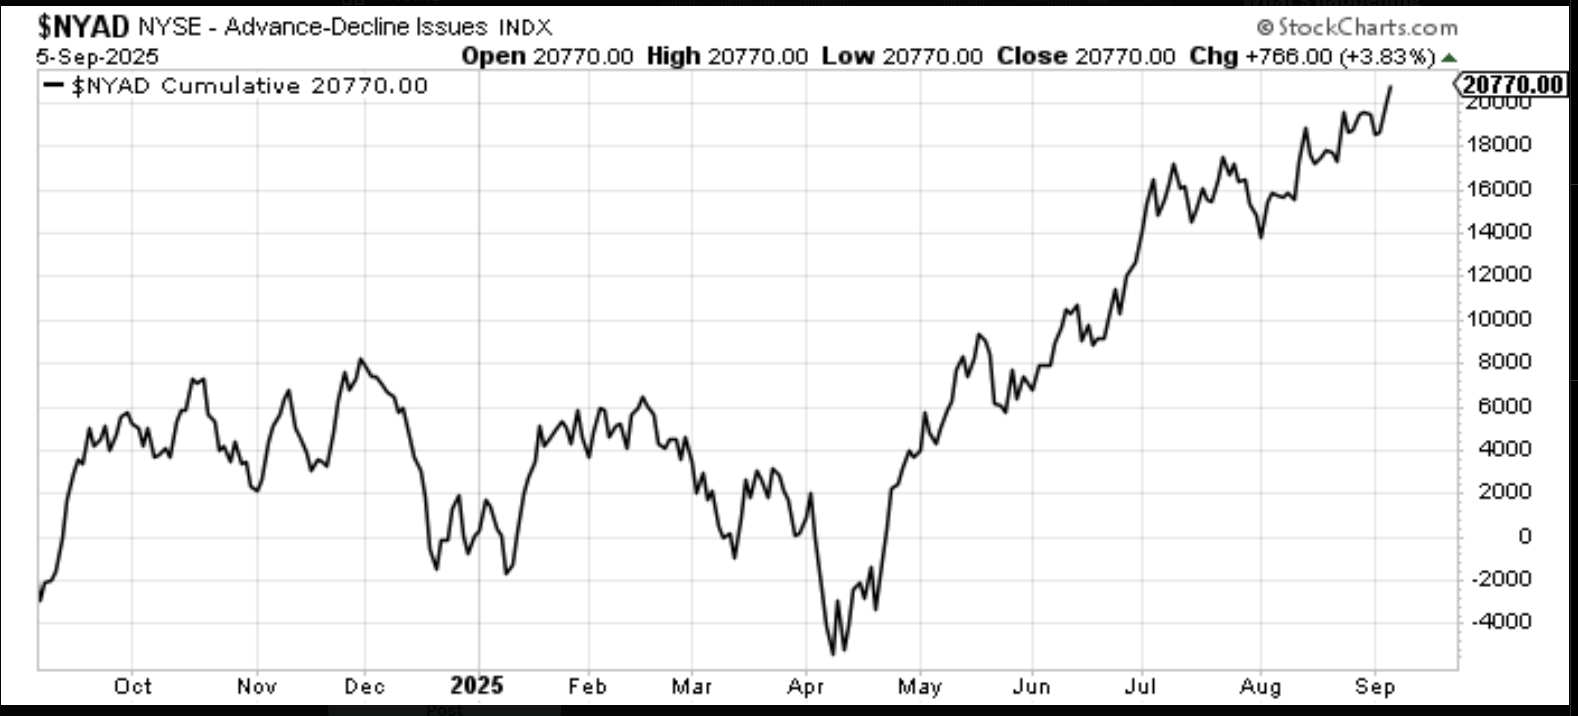
Helene Meisler’s always solid technical work noted the strong breadth at the end of last week’s rally.
Love to see charts like this, i.e. evidence that the stock market rally is still being supported by accumulation.
SP 500 EPS trends:
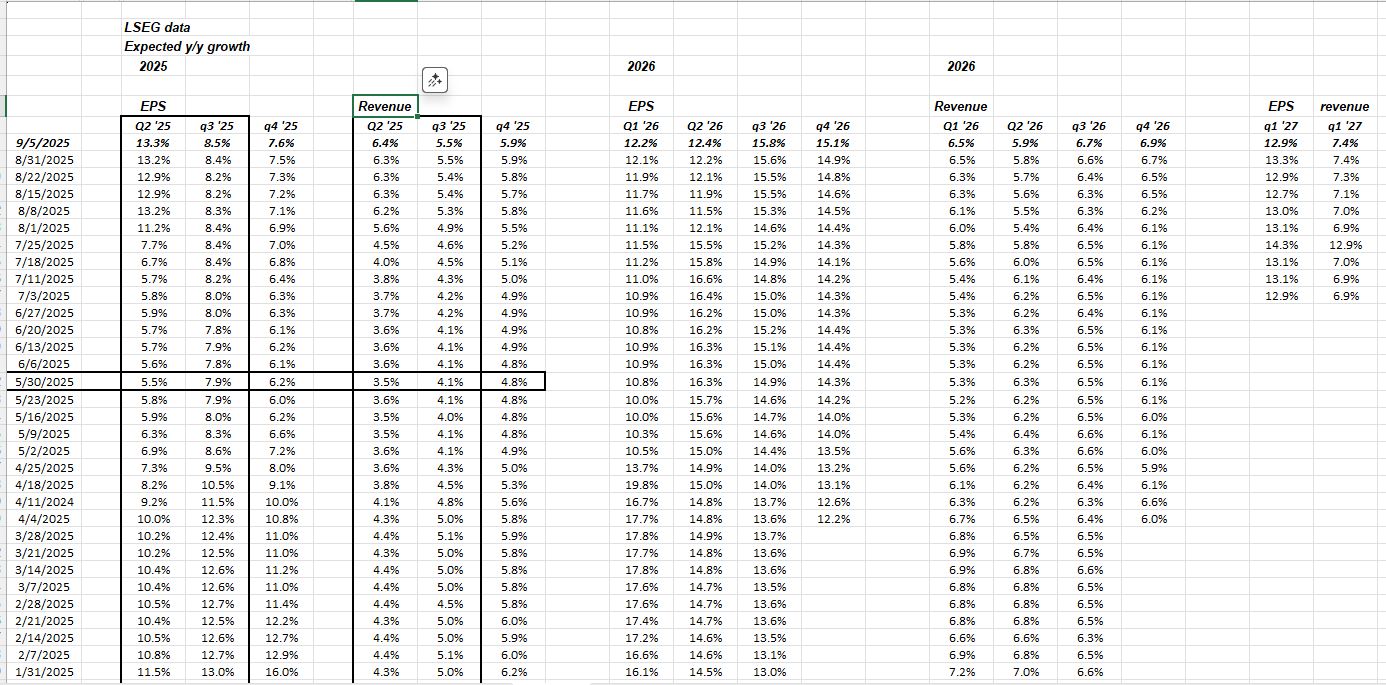
I like the spreadsheet table (data sourced from LSEG.com) which shows the progression of expected SP 500 EPS and revenue growth rates by week.
The horizontal bar is the week that the expected growth rates bottomed and have moved steadily higher since.
Everyone is now worried about NVDA, but if we look at the EPS and revenue revisions (not shown), both Nvidia’s EPS and revenue estimates for forward fiscal years have started moving higher (i.e. seeing progressively higher EPS and revenue estimates) once again.
Oracle reports Tuesday night, Sept 9th, after the closing bell, and while Oracle’s revenue revisions remain generally positive, the EPS revisions are somewhat mixed, which could indicate a margin issue. Oracle has been an AI powerhouse since early ’24, when it was trading around $100.
(No position in NVDA and only a small position in ORCL.)
Last data table: The forward 4-quarter estimate (FFQE):
![]()
Click on the above spreadsheet to highlight the detail.
The FFQE since April 11th (week of the market bottom), shows that the SP 500’s forward PE ratio has risen from 19x to 23x but that since 7/31/25, or the last 5 weeks, the FFQE has been revised sequentially higher each week, very unusual for this time of year.
The SP 500 earnings yield peaked at 5.25% – 5.5% in early April, and as of September 5th, was 4.38%.
The last time the SP 500 earnings yield was at this level, was 2021 when it drifted around 4.50% for most of the year.
But in 2021, we had zero interest rates and the Fed wasn’t even thinking about, “thinking about” raising the fed funds rate, per Jay Powell’s own comments.
Remember, a 25 basis point cut in a few weeks, only means the fed funds rate drops to 4.125%, still above 4%. As of Friday, September 5th’s close, the 1,2 and 5-year Treasury yield were all trading well below 4% yields.
2026’s expected EPS growth of 14% has been rock solid all year, slipping down to 13% only occasionally. 14% EPS growth means that the actual EPS growth for 2026 will be $300 per share or better, if all the trends remain the same here.
Remember, we ended 2020 with a $139.72 EPS figure (actual) for the SP 500.
Summary / conclusion:
Schwab’s Kevin Gordon’s chart shows the nonfarm payroll weakness is not from the private sector, which has important economic implications.
Both the key CPI releases on Thursday are expected to be slightly elevated at +0.3%, while the key PPI releases are expected at +0.4% on Wednesday.
Anxiety has been elevated around higher inflation for a while, and while the data isn’t moving towards 2% like it was a for a while.
Let’s see if the SP 500 EPS trends change in the last few weeks of the quarter. The strength has really been remarkable. The one place you can surely look at it in the equity markets and point to and say, “at least we don’t have to worry about that’ is SP 500 earnings and revenue trends.
Helene Meisler’s breadth chart is likely a function of this is as well.
None of this is advice or a recommendation, but only an opinion. Past performance is no guarantee of future results. Readers should gauge their own comfort with portfolio volatility and adjust accordingly.