With tech earnings out of the way, SP 500 earnings continue to be healthy, robust in fact, although that’s been the case for a while.
SP 500 data:
- The forward 4-quarter estimate was revised higher again (sequentially) to $253.25 from last weeks $252.55.
- The PE ratio on the forward estimate is 20.2x, equal with last week’s 20.2x.
- The SP 500 earnings yield was 4.94% versus last week’s 4.95%.
- The Q1 ’24 bottom-up estimate has risen from $54.92 to $55.78 in the last 6 weeks.
- With 397 SP 500 companies having reported, the “upside surprise” this quarter for SP 500 EPS is +8.4% bigger than the three previous quarters, which were quite strong in the mid to high-single-digits.
Here’s the last 4 quarter progression for SP 500 EPS upside / downside surprise:
- Q1 ’24: currently +8.4%
- Q4 ’23: +6.3% (final);
- Q3 ’23: +7.2% (final);
- Q2 ’23: +7.9% (final)
This week’s numbers likely don’t include Apple, since they reported Thursday night after the closing bell. Any revisions will likely show up early next week in the LSEG numbers.
SP 500: expected quarterly EPS and revenue growth rates
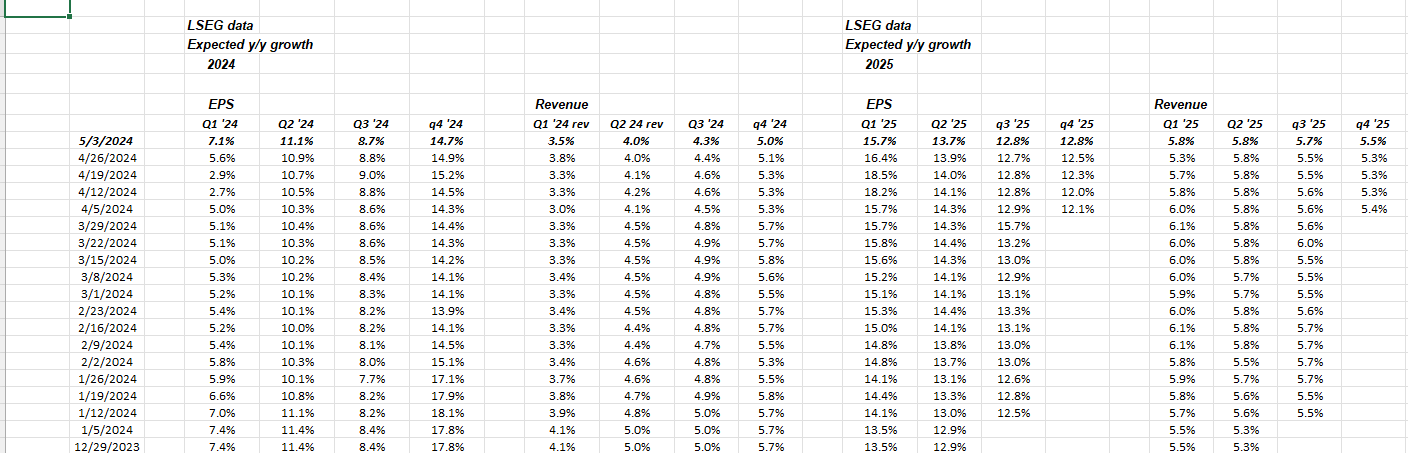
Note the Q1 ’24 EPS column: investors started 2024 looking at an expected 7.4% SP 500 EPS growth rate for Q1 ’24, which then fall all the way to 2.7% the week of 4/12/24, and has now bounced back rapidly to +7.1% as of this week, 5/3/24, and will likely work higher in the next few weeks.
As the old Led Zeppelin song was titled, “The Song Remains the Same”.
Let’s look at “rate-of-change”:
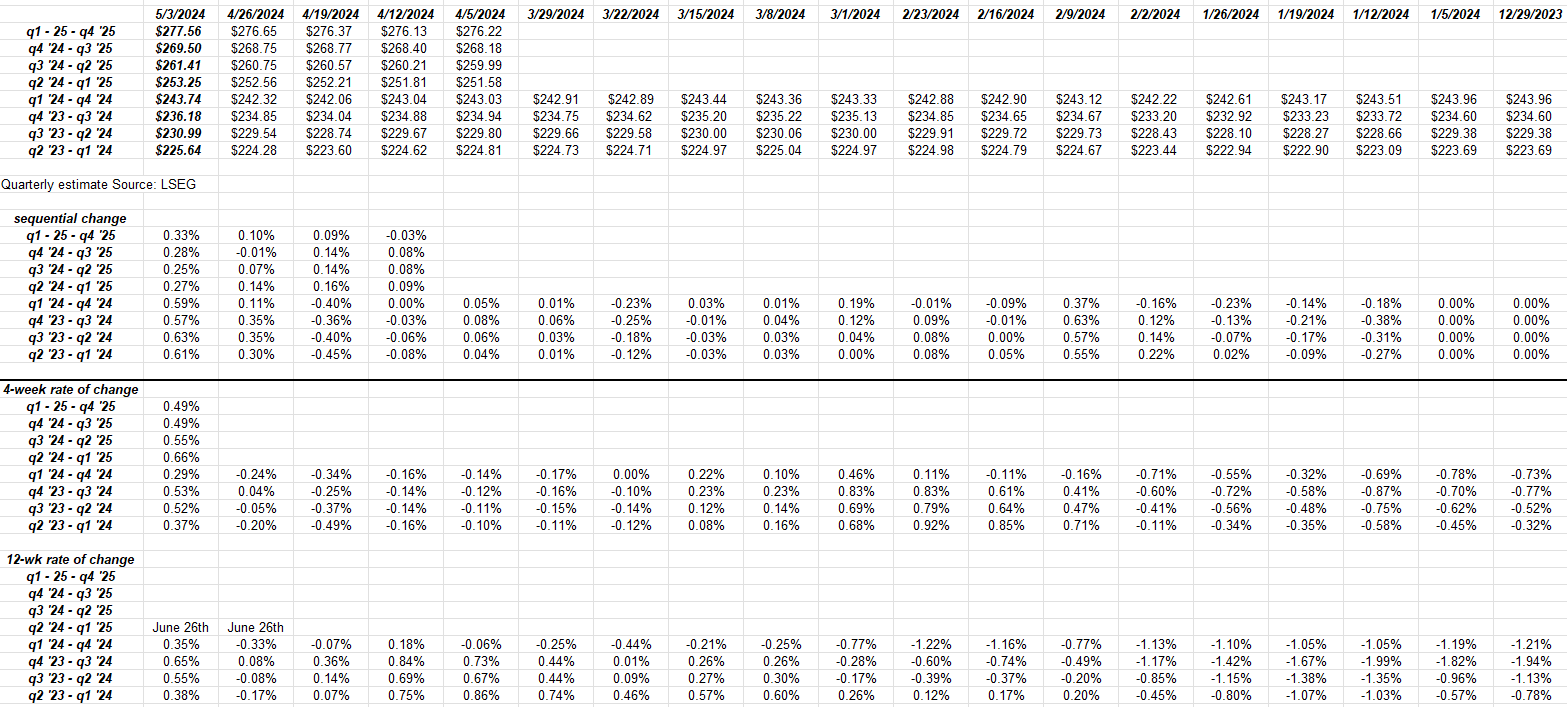
Haven’t shown this graph to readers in a while and it’s proprietary work.
Note the first column, and the various 4 quarter segments: this is like a forward SP 500 EPS curve (i.e. like the Treasury curve ) using forward 4-quarter SP 500 EPS estimates.
Note from the bottom to the top – from Q2 ’23 through Q1 ’24 (starting bucket) through Q1 ’24 to Q4 ’25, (final bucket), the SP 500 EPS is expected to increase $50 in dollars, not percentages.
Just taking the straight math of trailing twelve month EPS of $225.64 and then divide it into the “forward 4-quarter estimate” the difference is $25.
This changes every week, but i wanted to give readers some feel for the actual dollar EPS involved since it’s always about percentages.
Note the 1-week and 4-week rates of change: they are still being revised upward, when the typical pattern is toe see negative revisions.
Here’s the current SP 500 EPS estimate for 2024 – 2026:
- 2026 est: $310.23
- 2025 est: $277.56
- 2024 est: $243.74
Readers will laugh (or cringe) but taking the SP 500’s close today and dividing it by $310 or the 2026 EPS estimate leaves the SP 500 with a 16x PE at the close today.
SP 500 earnings are decent, and it’s more than just the Mag 7: almost every sector of the SP 500 except industrials and health care are showing higher expected growth rates for ’24 (full-year) than in early Jan 24.
The strongest revisions higher are communication services (likely due to GOOGL) and financials.
None of this is advice or an recommendation. Past performance is no guarantee of future results. Investing can involve loss of principal even for short periods of time. Capital markets can change quickly, both positively and negatively. Readers should evaluate their own comfort with portfolio volatility and adjust accordingly.
Summary / conclusion: Despite good Q1 ’24 earnings reports the major tech / discretionary and / communication services companies have yet to take out recent all-time-highs. Microsoft is still short of it’s recent ATH near $430. Amazon is still short of the 2021 ATH’s near $188 – $189. Until today, Bonds just haven’t helped the equity market much. In Q4 ’23 and q1 ’24 the SP 500 returned roughly 10% each quarter and then as soon as the 10-year Treasury yield drifted back towards 5% or the high yield from last October ’23, the SP 500 lost 4% in April ’24.
Rising interest rates and the uncertainty around Fed policy are like a wet blanket for the stock market. Last night this blog post tried to make a case that longer-term Treasury returns were getting stretched to the downside, but after nearly 8 years of ZIRP (2008 to 2016) and then another 2 years of ZIRP (March ’20 to March ’22) maybe it will take still higher rates to slow the US economy.
We just don’t know.
But we do know SP 500 earnings continue healthy. One favorite indicator is to watch the credit card data out of the major banks each month. It’s unsecured credit so if a US consumer has a choice between not paying the credit card bill or the mortgage, guess which one will be neglected ?
Also, keep an eye on high yield credit spreads. That’s another early-warning indicator. They do need to widen a little (in my opinion). High yield credit spreads peaked at 13% – 15% in 2002 and 2003 with Enron and Worldcom defaults, and then blew out to 25% in 2008. (In hindsight, that’s pretty amazing. High yield today – the ETF’s like SHYG and HYG – yield 7.50% – 8%.
Thanks for reading.