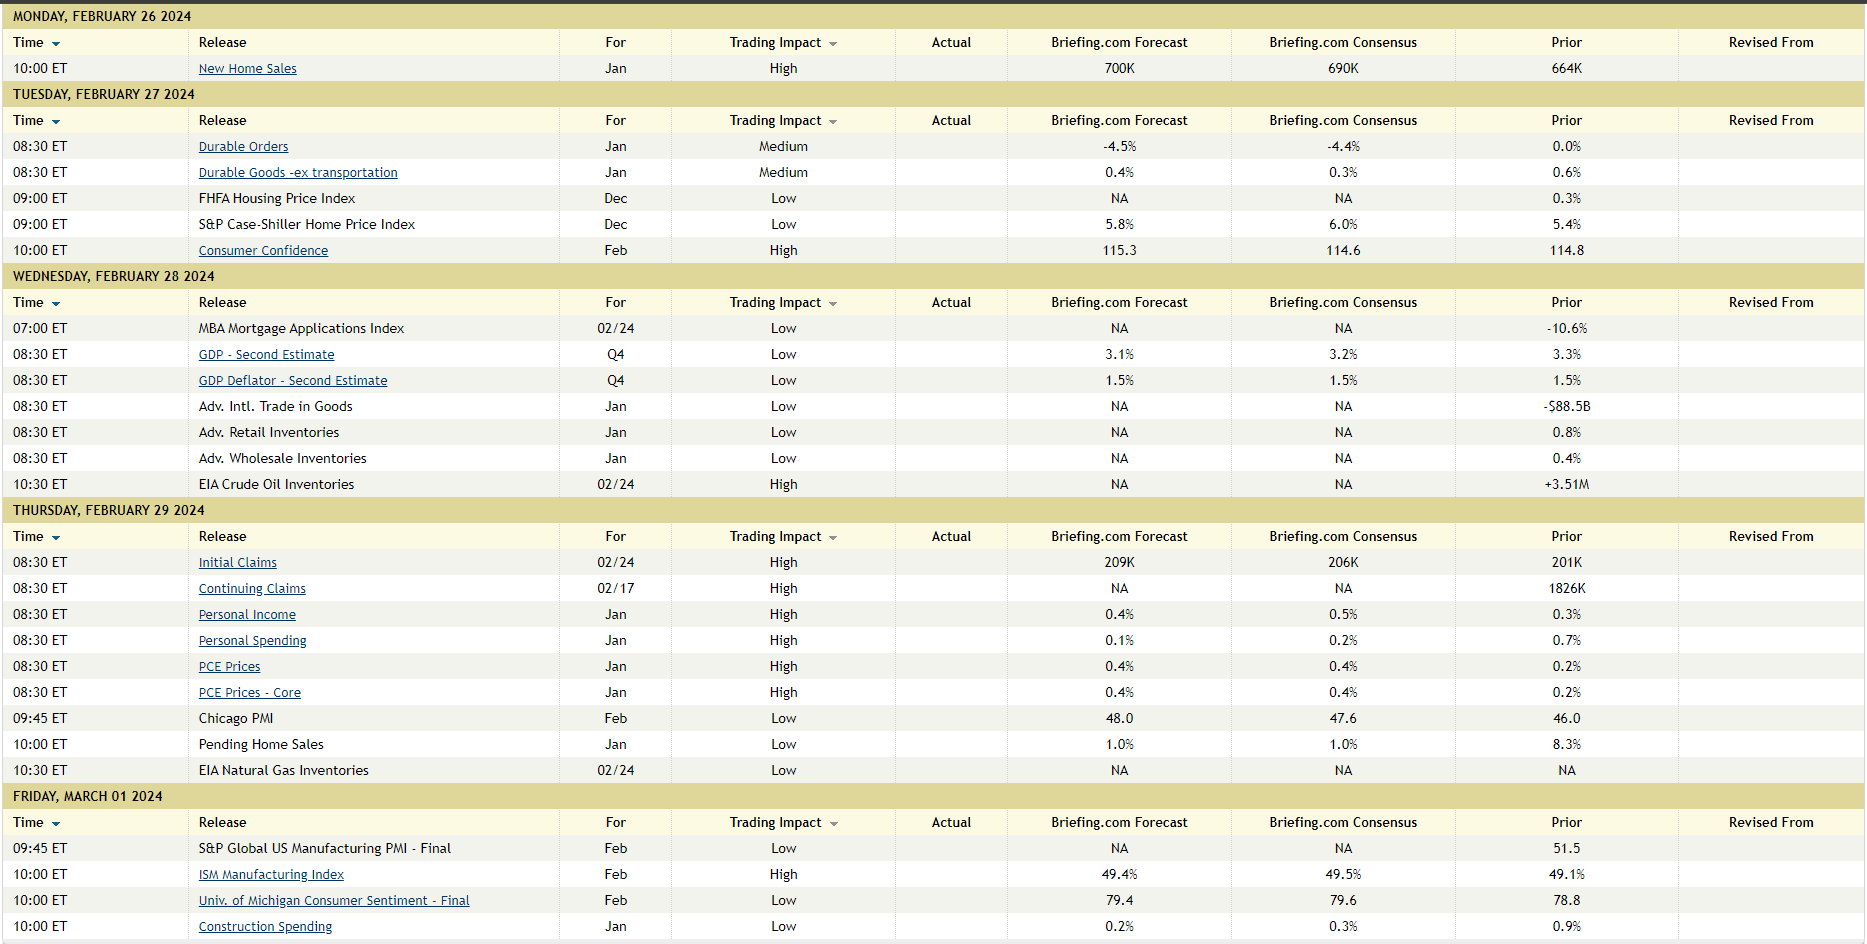
This comprehensive economic calendar from Briefing.com shows the expected economic data releases for the coming week. Given the jump in CPI and PPI data for January ’24, there is a lot of interest in what the January PCE data will show Thursday morning, February 29th.
Consensus expectations are looking for +0.4% for overall PCE and +0.4% for PCE Core, per the above table.
Economic measurements fascinate me in the sense that the financial media headlines can differ greatly from what the various releases actually measure. Always watch the stock and bond market’s reaction to the data, as well as the data itself.
Why so many inflation measures ? With a $27 trillion economy, I’m glad there are various ways or measures to track inflation. The CPI and PPI data are known as “fixed weight” measures, meaning that the CPI and PPI, track two apples and two oranges over time, and make no adjustment for changes in consumer purchasing patterns. The CPI’s “fixed-weight” measures goods only for the last last for 24 months, and are changed or adjusted in January of even calendar years. Could that explain the hotter January CPI and PPI in ’24 ? Doubtful, given that the pressure in January ’24 CPI and PPI seemed to originate from “shelter”, one of the biggest components of the CPI.
PCE, on the other hand, includes government data (such as Medicare) and seems to account for changes in purchasing patterns over time.
Here is a good article from the CEA (Council of Economic Advisors) from Sept ’23 comparing or contrasting CPI / PPI vs the PCE data.
Don’t forget about “inflation expectations” too. It isn’t necessarily what the inflation rate is today that matters, but what inflation’s expected to do over the next 3 – 6 months.
Personally, I do think inflation continues to decline, but the underlying strength in economic data, particularly services, is making it difficult to get inflation down to the 2% level the Fed desires.
FXI Chart
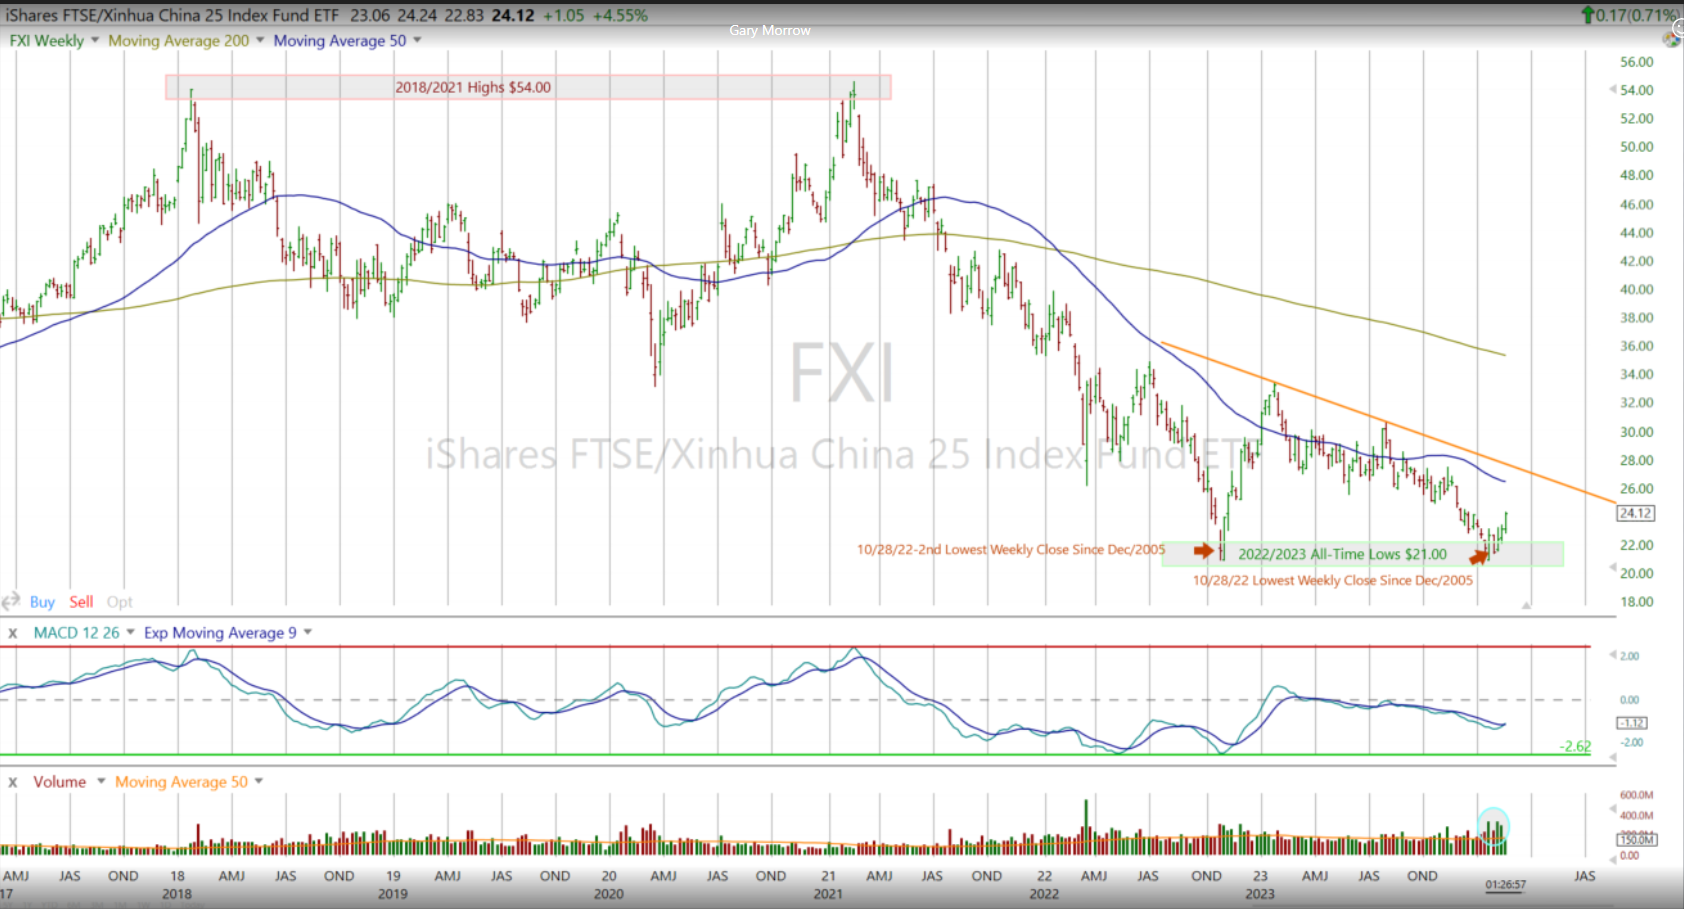
A long-time source of good technical analysis for this blog, Gary Morrow (@garysmorrow), shot this over to me Friday, highlighting the double-bottom in the FXI (iShares FTSE / Xinhua China 25 Index Fund ETF) chart. The China central bank cut their 5-year prime loan interest rate last weekend, purportedly to help struggling property values. This blog updated international / Non-US returns last week as of January 31, 24 here.
High-Yield Credit
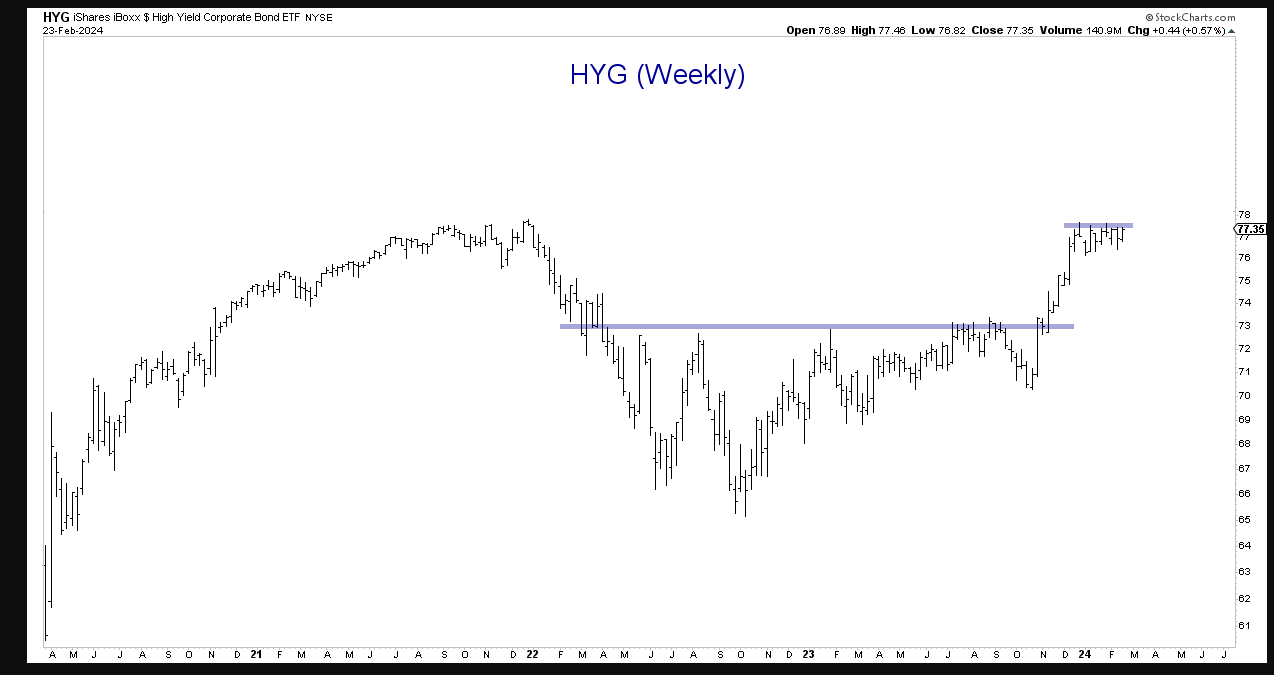
Love this chart from BrianG over at AlphaCharts, published this weekend. This blog is a subcriber to Brian’s work.
If HYG breaks above this consolidation, it’s tough to make a bearish case for stocks. Corporate High-yield is always the early warning indicator for equity problems.
Final note: Good interview by Compound & Friends, Josh Brown recently of Ryan Detrick of Carson Group. Enjoyed Josh’s “crabs” story (no, not those kind of crabs) too. Couldn’t listen to the whole 90 minutes. Stayed for the first 30 minutes.
None of any of the above is advice or a recommendation. Past performance is no guarantee or suggestion of future results. Investing can involve loss of principal, even for short time periods. All earnings related data is typically sourced from LSEG unless otherwise noted. Readers should gauge their own comfort with portfolio volatility and adjust accordingly.
Thanks for reading.